
Skip to content
Aerial view at dusk of Signal Hill and Cabot Tower above the Narrows, with the St. John's harbour and downtown glowing beyond

Neighbourhood market data

St. John's real estate market

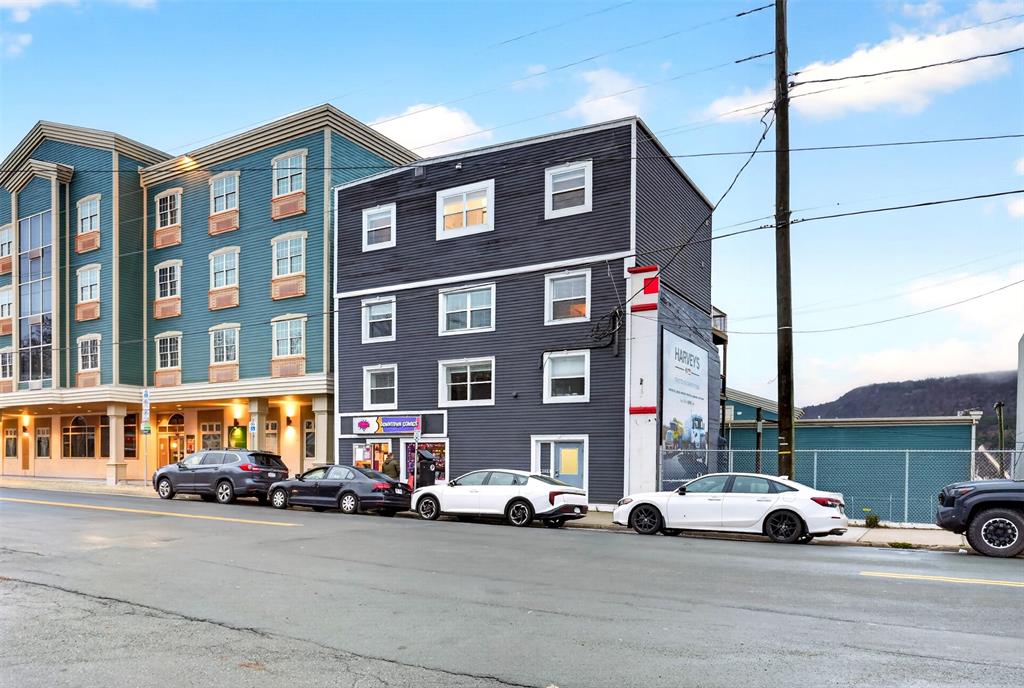
The capital and the region's largest market, from downtown rowhouses to established suburbs on the east and west ends.

Balanced marketApex Atlas data as of November 19, 2026

Photo: Shhewitt, CC BY-SA 4.0 (cropped)

12-month median
$400,000sold price
12-month average
$425,000sold price
Sales
1,438last 12 months
Avg days on market
32last 12 months
Price per sq ft
$204median
Months of supply
4.6Balanced market548 active listings

Last 12 months to November 19, 2026. Apex Atlas analysis of NLAR MLS® residential solds.

Five years of data

St. John's prices and sales over time

Median sold price by month

$273K$358K$442KDec 2021Oct 2022Aug 2023Jun 2024Apr 2025Feb 2026Nov 2026
St. John's median sold price by month, last five years
PeriodValue
Dec 2021$291K
Jan 2022$300K
Feb 2022$292K
Mar 2022$285K
Apr 2022$294K
May 2022$307K
Jun 2022$310K
Jul 2022$325K
Aug 2022$317K
Sep 2022$334K
Oct 2022$302K
Nov 2022$310K
Dec 2022$315K
Jan 2023$294K
Feb 2023$298K
Mar 2023$297K
Apr 2023$298K
May 2023$335K
Jun 2023$329K
Jul 2023$343K
Aug 2023$337K
Sep 2023$336K
Oct 2023$325K
Nov 2023$345K
Dec 2023$325K
Jan 2024$320K
Feb 2024$322K
Mar 2024$337K
Apr 2024$357K
May 2024$328K
Jun 2024$370K
Jul 2024$365K
Aug 2024$381K
Sep 2024$364K
Oct 2024$345K
Nov 2024$373K
Dec 2024$380K
Jan 2025$385K
Feb 2025$368K
Mar 2025$357K
Apr 2025$367K
May 2025$389K
Jun 2025$390K
Jul 2025$391K
Aug 2025$380K
Sep 2025$393K
Oct 2025$382K
Nov 2025$406K
Dec 2025$406K
Jan 2026$351K
Feb 2026$370K
Mar 2026$385K
Apr 2026$407K
May 2026$410K
Jun 2026$425K
Jul 2026$405K
Aug 2026$385K
Sep 2026$430K
Oct 2026$408K
Nov 2026$393K

Average sold price by month

$289K$383K$476KDec 2021Oct 2022Aug 2023Jun 2024Apr 2025Feb 2026Nov 2026
St. John's average sold price by month, last five years
PeriodValue
Dec 2021$310K
Jan 2022$324K
Feb 2022$312K
Mar 2022$302K
Apr 2022$322K
May 2022$334K
Jun 2022$337K
Jul 2022$350K
Aug 2022$351K
Sep 2022$339K
Oct 2022$332K
Nov 2022$341K
Dec 2022$357K
Jan 2023$330K
Feb 2023$319K
Mar 2023$317K
Apr 2023$313K
May 2023$344K
Jun 2023$349K
Jul 2023$360K
Aug 2023$357K
Sep 2023$370K
Oct 2023$333K
Nov 2023$381K
Dec 2023$356K
Jan 2024$365K
Feb 2024$355K
Mar 2024$374K
Apr 2024$382K
May 2024$335K
Jun 2024$402K
Jul 2024$385K
Aug 2024$404K
Sep 2024$366K
Oct 2024$371K
Nov 2024$387K
Dec 2024$391K
Jan 2025$418K
Feb 2025$381K
Mar 2025$395K
Apr 2025$378K
May 2025$411K
Jun 2025$413K
Jul 2025$417K
Aug 2025$426K
Sep 2025$413K
Oct 2025$407K
Nov 2025$422K
Dec 2025$435K
Jan 2026$378K
Feb 2026$386K
Mar 2026$404K
Apr 2026$406K
May 2026$422K
Jun 2026$421K
Jul 2026$430K
Aug 2026$429K
Sep 2026$463K
Oct 2026$437K
Nov 2026$430K

Sales in each 12 months

1,837Nov 20221,473Nov 20231,528Nov 20241,634Nov 20251,391Nov 2026
St. John's residential sales in each 12-month period, labelled by the final month
ItemValue
Nov 20221,837
Nov 20231,473
Nov 20241,528
Nov 20251,634
Nov 20261,391

What the numbers mean

Reading the St. John's market

Written from the figures above, with the same rules for every community. Nothing here is a forecast.

What this means for sellers

There is about 4.6 months of supply (548 active listings against 1,438 sales in the last 12 months). That sits between 4 and 7 months, which we classify as a balanced market: well-priced homes sell, and buyers can compare. Homes sold in St. John's averaged 32 days on market over the last 12 months, faster than the roughly 38 days the year before, so pace is on your side. The median sold price over the last 12 months was $400,000, 29.9% above the median sold price in the 12 months ending four years ago, the oldest year of our five-year window. Your own street and home type matter more than any community median, which is why we price from street-level comparables.
What this means for buyers

With about 4.6 months of supply (548 active listings against 1,438 sales in the last 12 months), there is a fair amount to look at without the pressure of a very tight market. Well-priced homes still go quickly. Homes sold in St. John's averaged 32 days on market over the last 12 months, faster than the roughly 38 days the year before, so well-priced homes are not sitting long. The median price per square foot was $204, a useful yardstick when you compare homes of different sizes.

About the community

St. John's at a glance

The capital and the region's largest market, from downtown rowhouses to established suburbs on the east and west ends.

Compare with: Mount Pearl, Paradise, Conception Bay South, Torbay, Flatrock

St. John's real estate questions

What is the median home price in St. John's?

The median sold price in St. John's over the 12 months to November 19, 2026 was $400,000 and the average sold price was $425,000, based on 1,438 residential sales on the MLS®. The median price per square foot was $204. The median across the last five years of sales was $350,000.

How long do homes take to sell in St. John's?

Homes sold in St. John's averaged 32 days on market over the 12 months to November 19, 2026. That is faster than the roughly 38 days the year before.

Is St. John's a buyer's or seller's market?

As of November 19, 2026, St. John's is a balanced market by our measure, with about 4.6 months of supply (548 active listings against 1,438 sales in the last 12 months). We call under 4 months of supply a seller's market, 4 to 7 balanced, and over 7 a buyer's market.

How many homes sold in St. John's in the last 12 months?

1,438 residential homes sold in St. John's in the 12 months to November 19, 2026, and 548 were active on the MLS® on that date.

How have home prices changed in St. John's?

The median sold price over the last 12 months ($400,000) is 29.9% above the median sold price in the 12 months ending four years ago, the oldest year of our five-year window. Medians describe the whole community, so a particular street or home type can differ.

Thinking about St. John's?

Tell us what you are weighing up. A REALTOR® on our team will come back with street level numbers, not a community average.

Market figures are Apex Atlas analysis of residential MLS® solds licensed from the Newfoundland and Labrador Association of REALTORS®. Medians and averages are Apex's own derived analytics. Estimates are not appraisals. MLS®, REALTOR® and the associated logos are trademarks of The Canadian Real Estate Association. DDF® is owned by CREA. Each RE/MAX office is independently owned and operated.