
Photo: Shhewitt, CC BY-SA 4.0 (cropped)
Balanced market
St. John's real estate market
- 12-mo median
- $400,000
- 12-mo average
- $425,000
- vs 5 years ago
- +29.9%
- Avg DOM
- 32 d
1,438 sales in 12 months to Nov 19, 2026


Neighbourhood intelligence
Five years of residential sales across the Northeast Avalon. Choose a community to see prices, pace and supply.
Community by community
Each card uses the same live figures as the community page: the median and average sold price over the last 12 months, how that compares with five years ago, and the average days on market.
Photo: Shhewitt, CC BY-SA 4.0 (cropped)
1,438 sales in 12 months to Nov 19, 2026
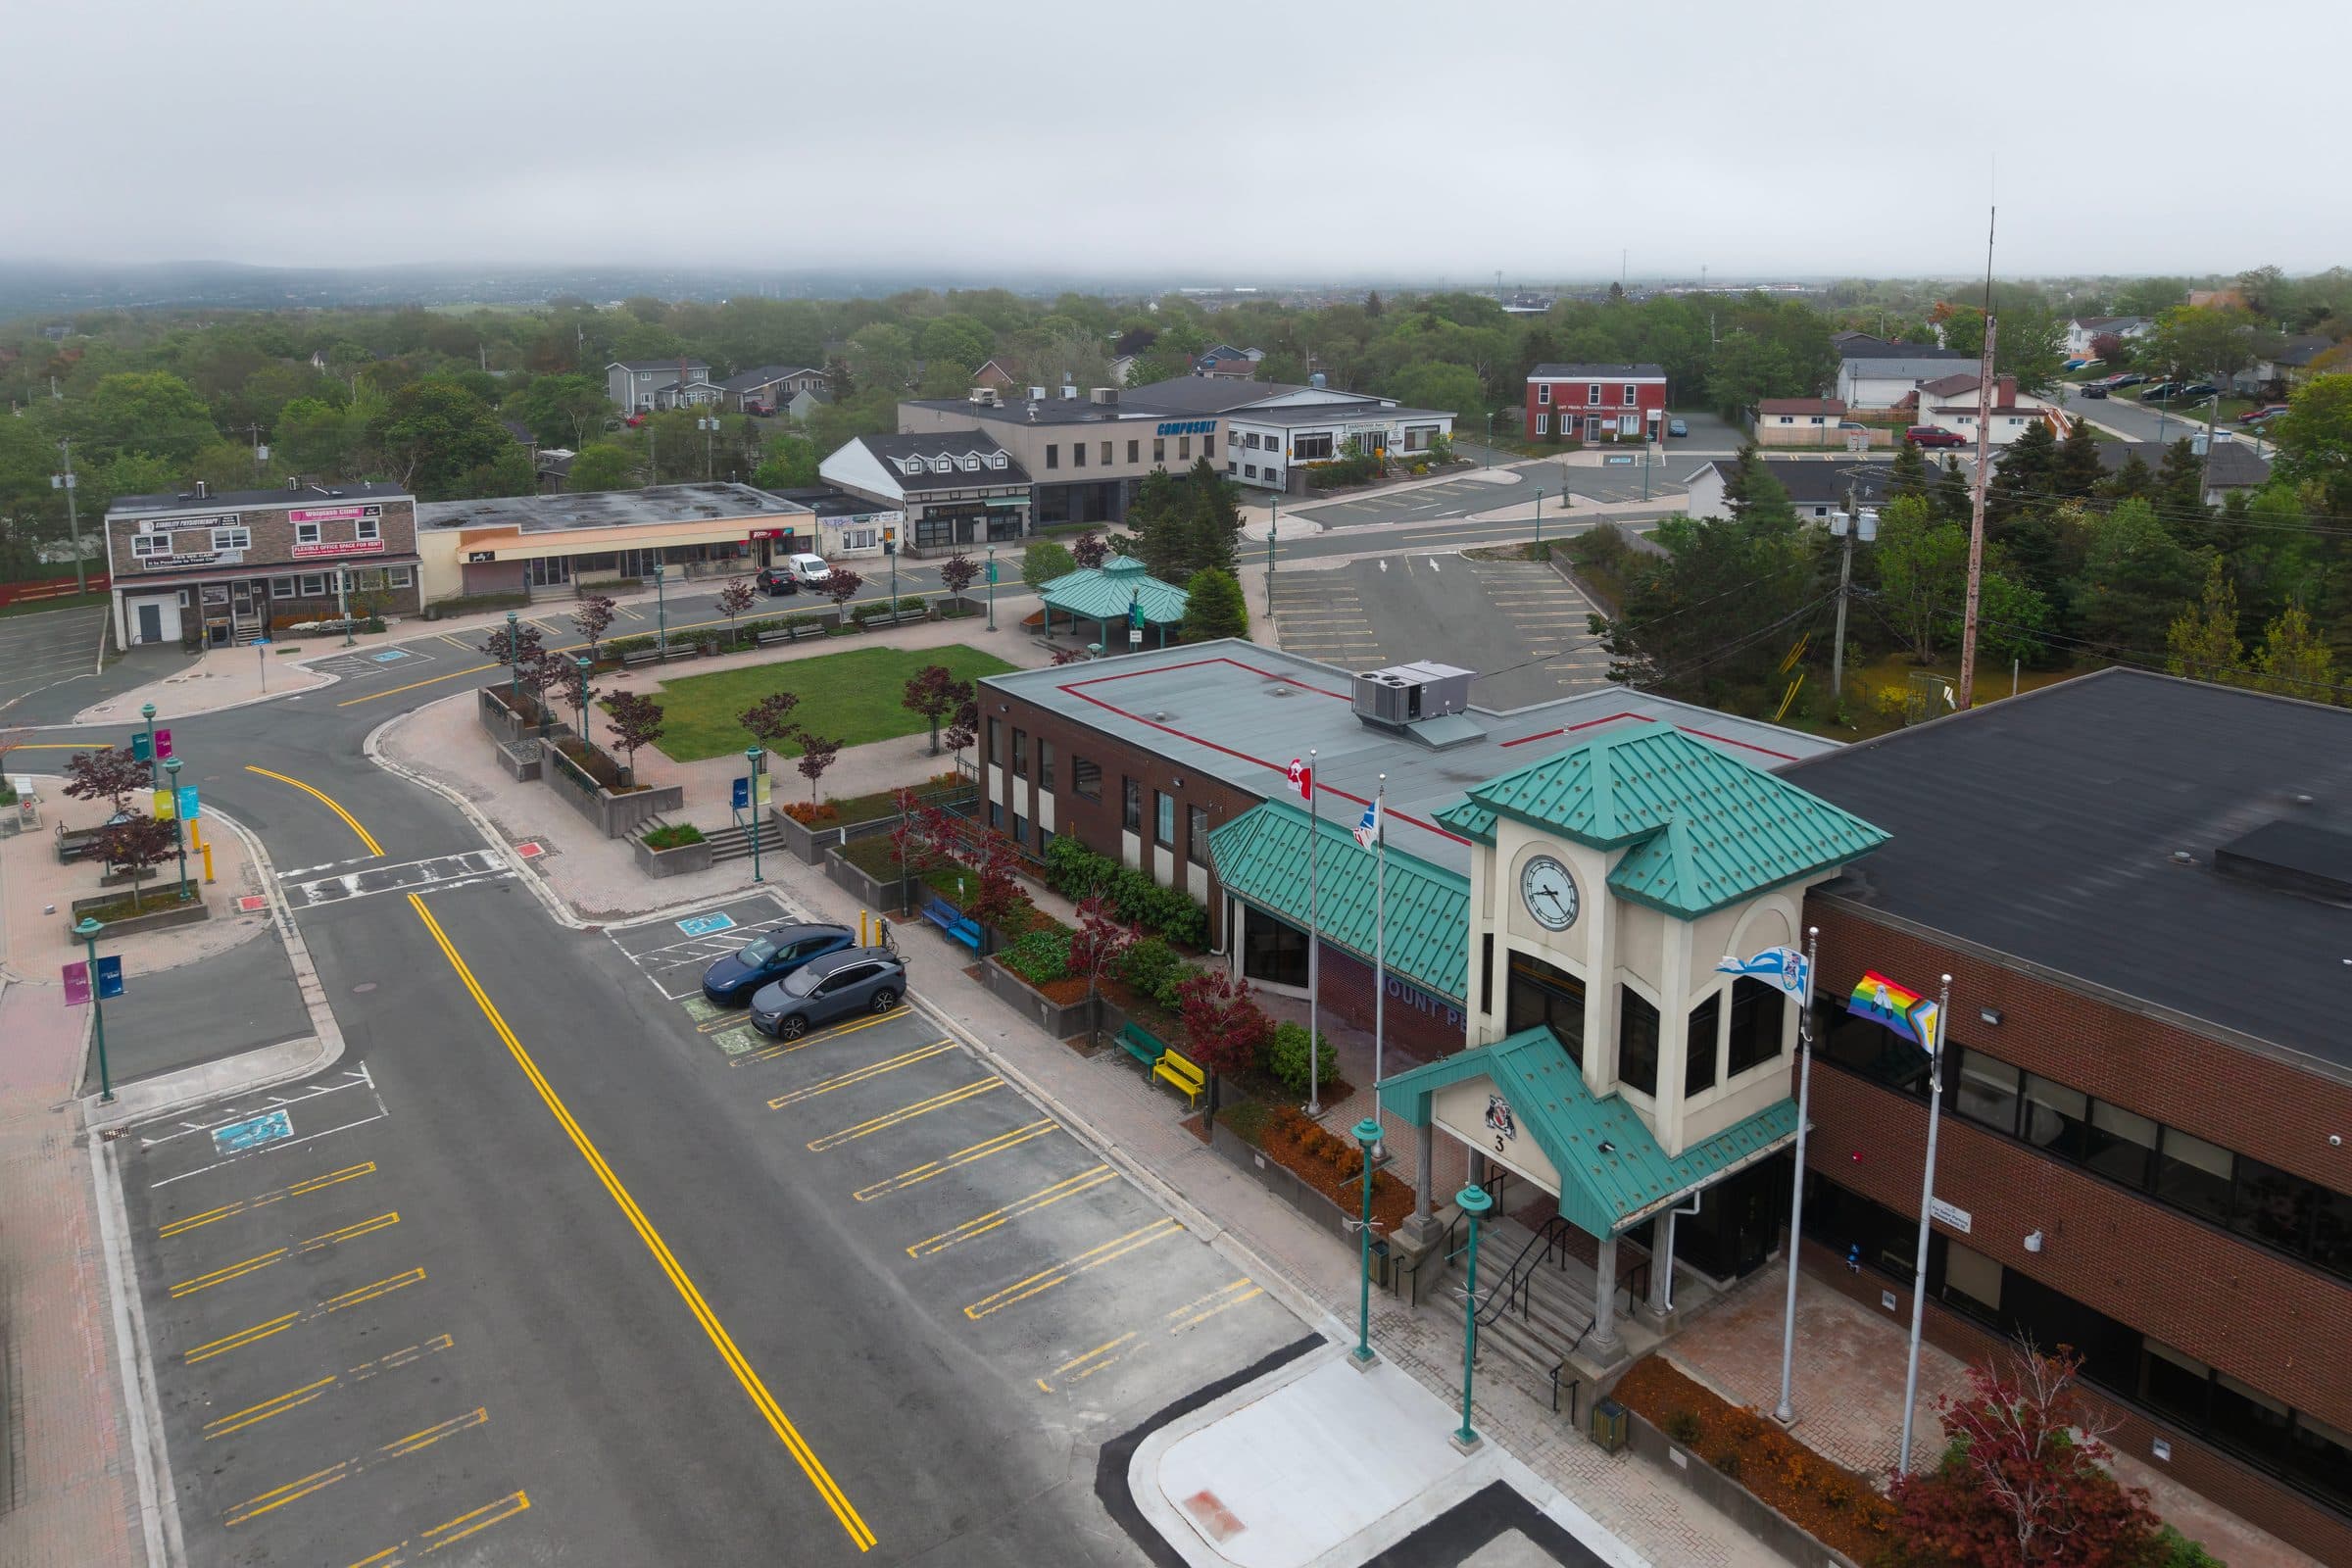
Photo: Quintin Soloviev, CC BY 4.0 (cropped)
305 sales in 12 months to Nov 19, 2026
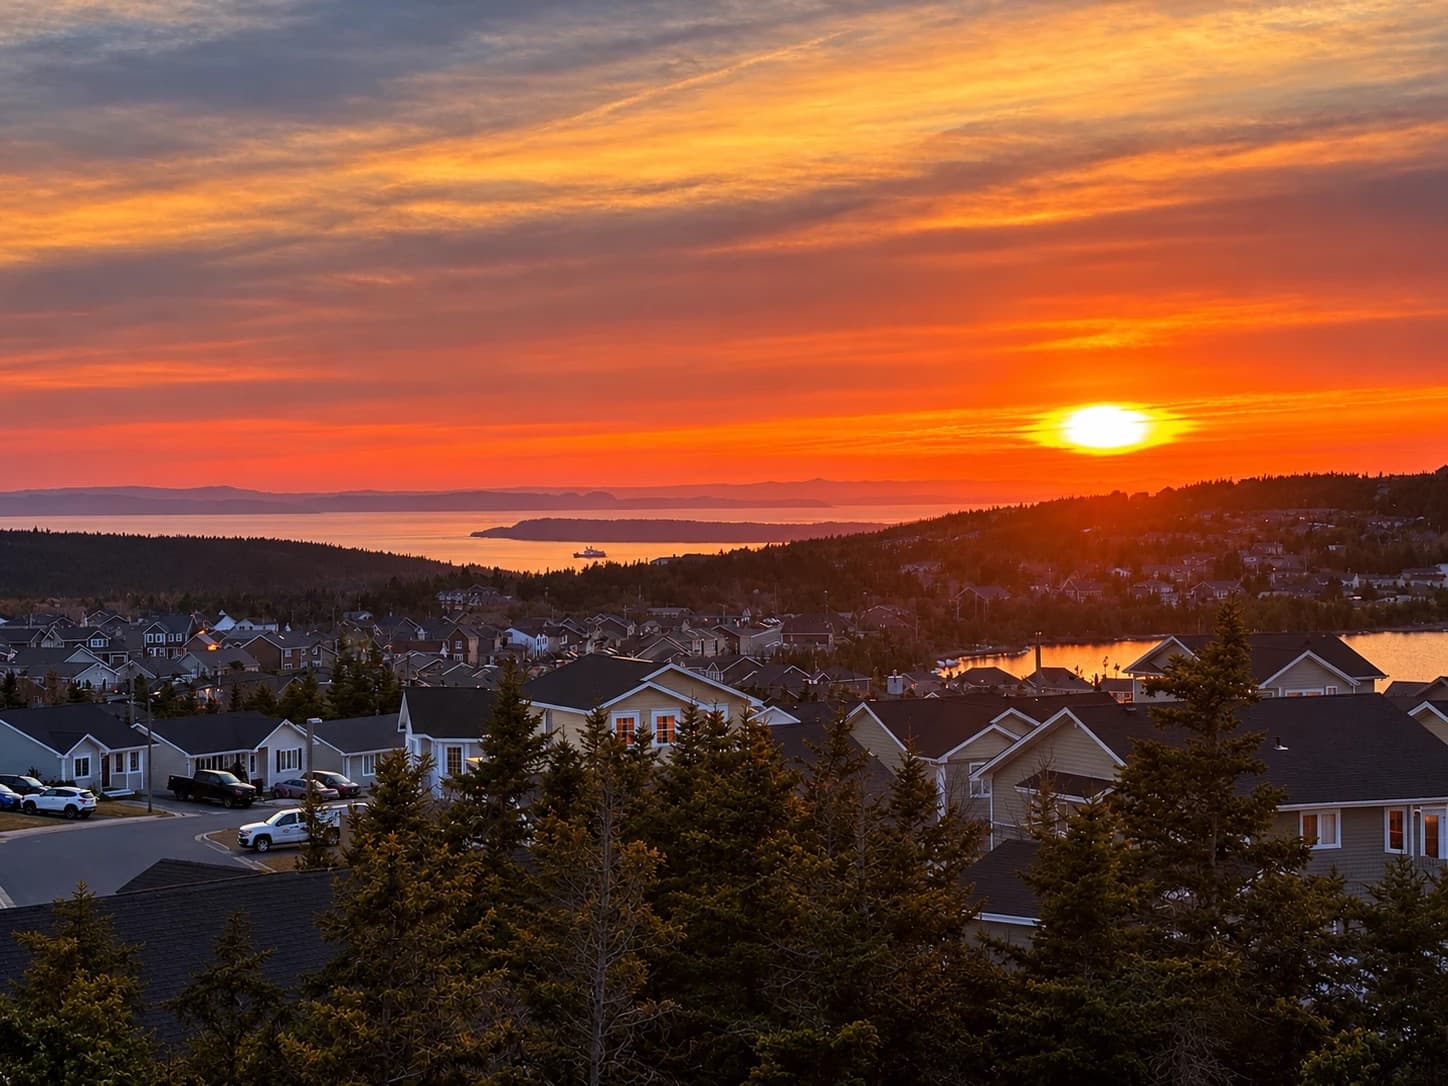
481 sales in 12 months to Nov 19, 2026

Photo: Thepon, CC BY-SA 3.0 (cropped)
413 sales in 12 months to Nov 19, 2026
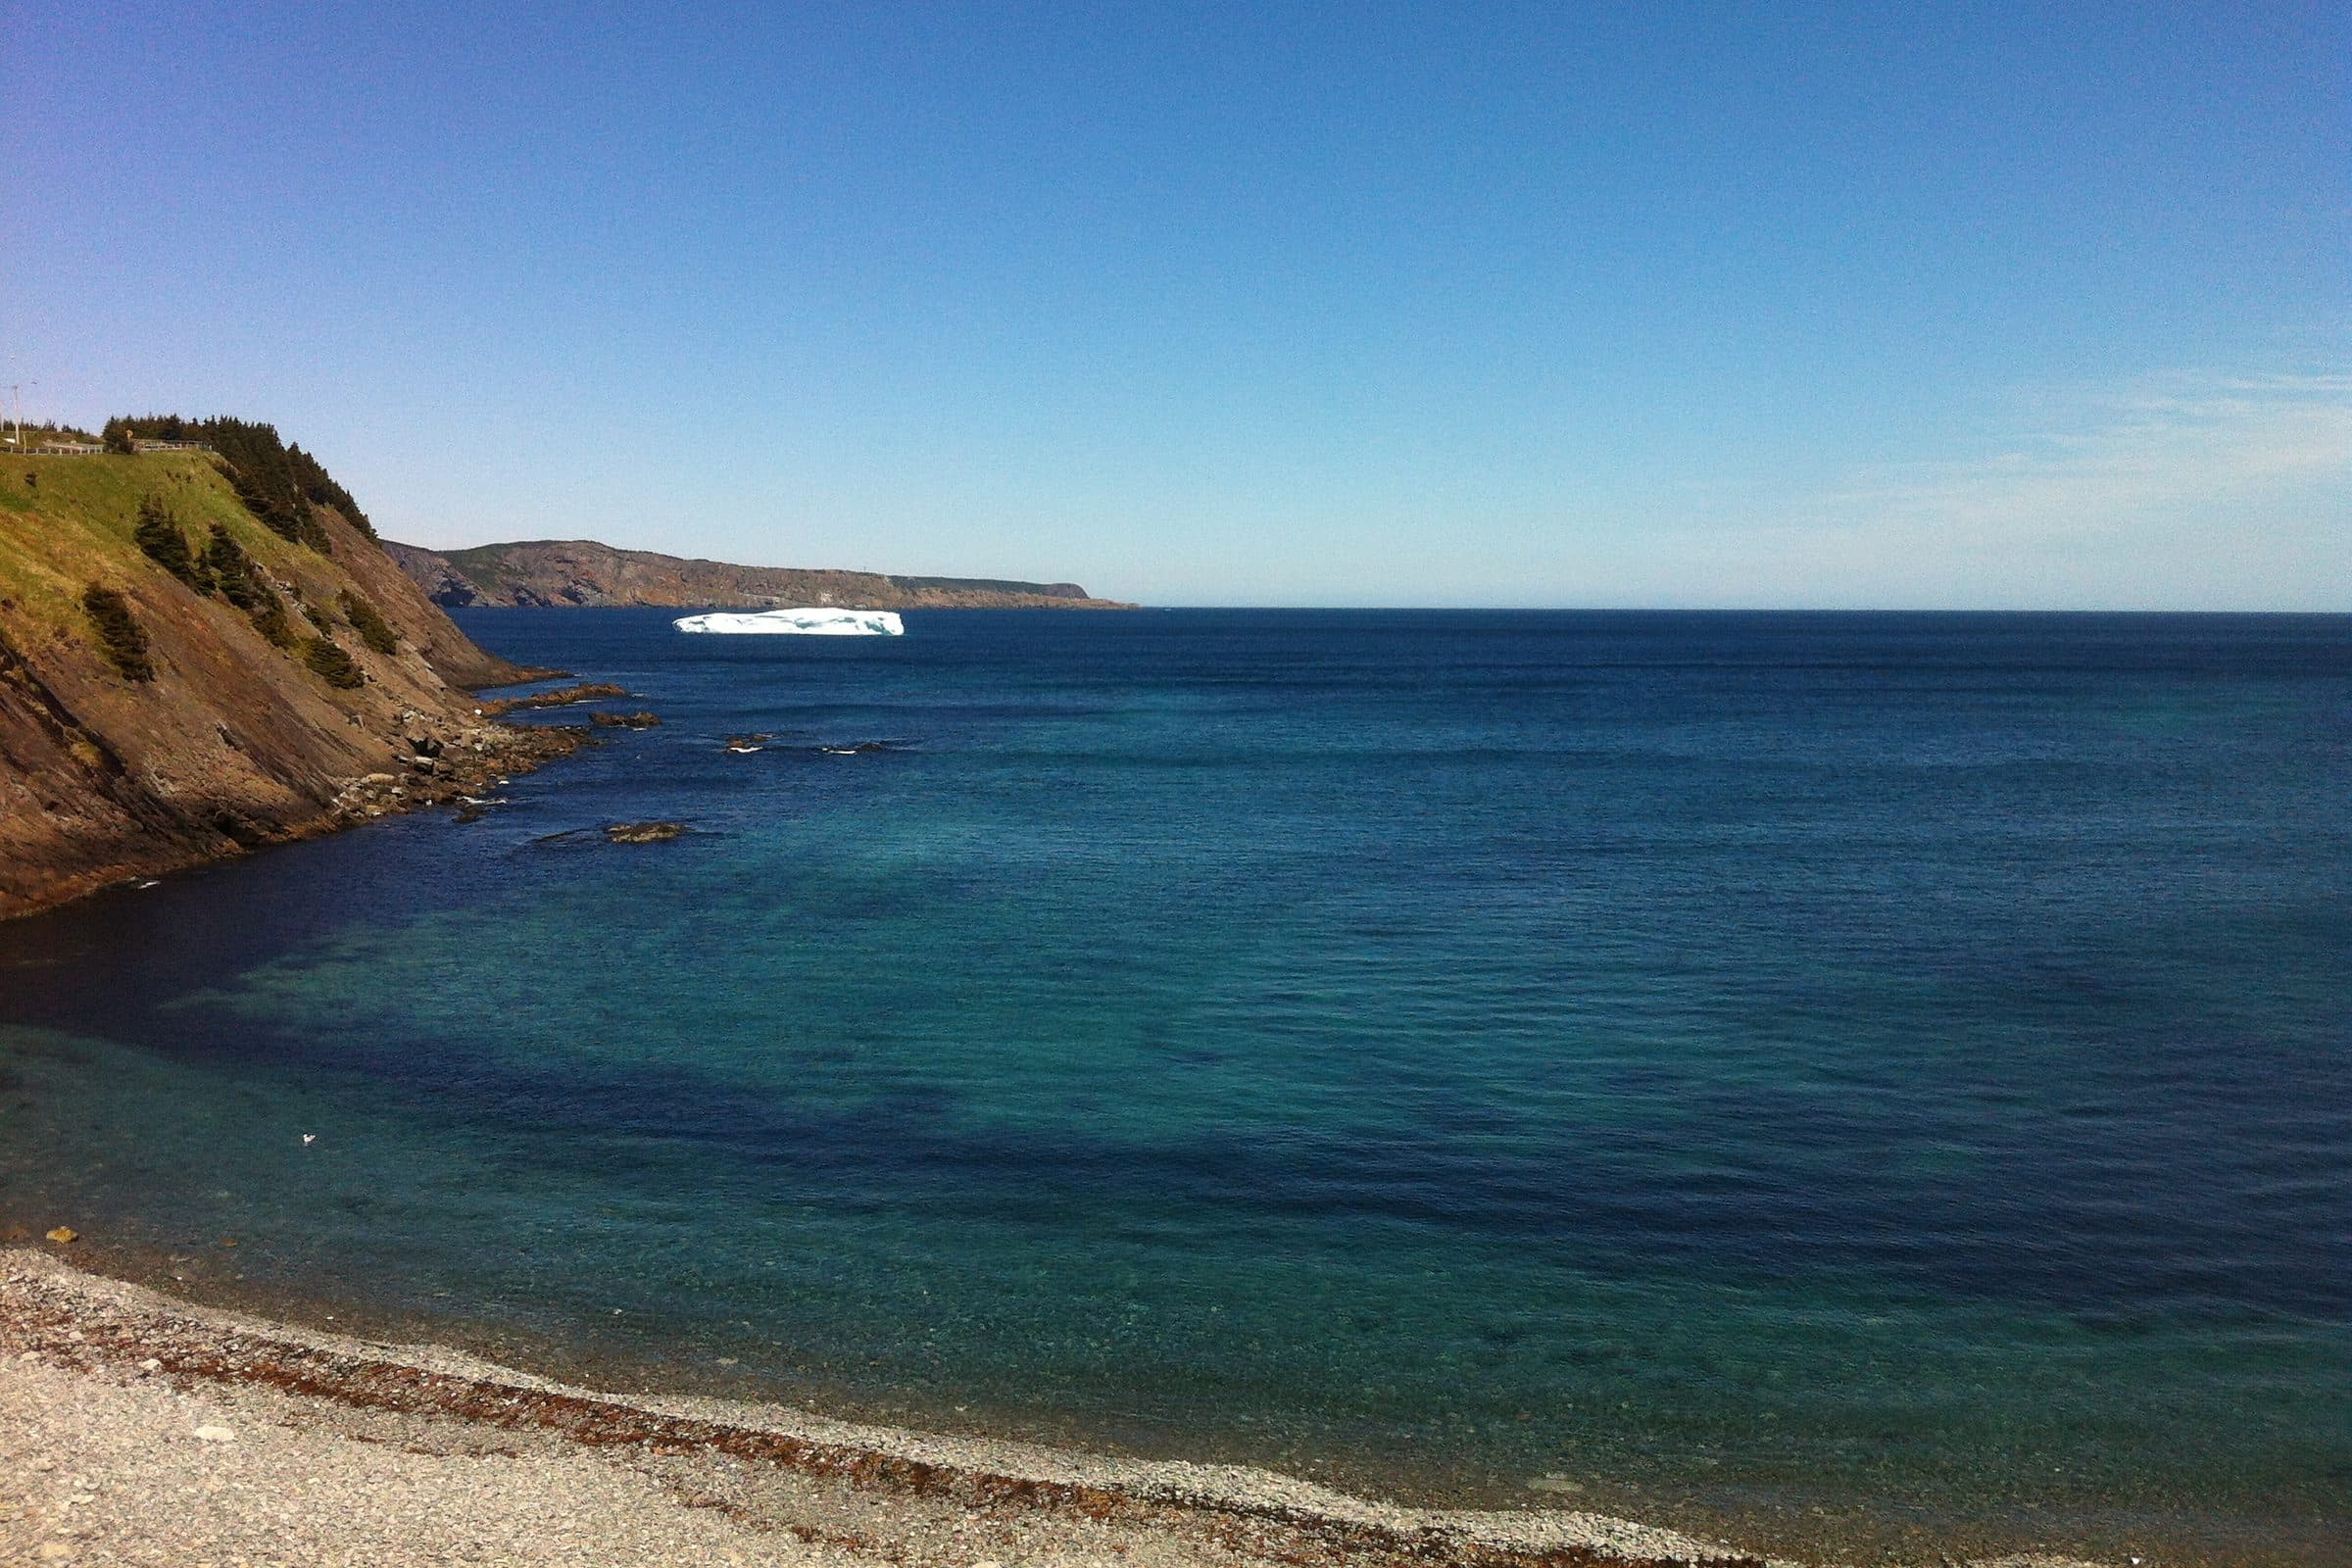
Photo: Jeremy Keith from Brighton and Hove, United Kingdom, CC BY 2.0 (cropped)
85 sales in 12 months to Nov 19, 2026
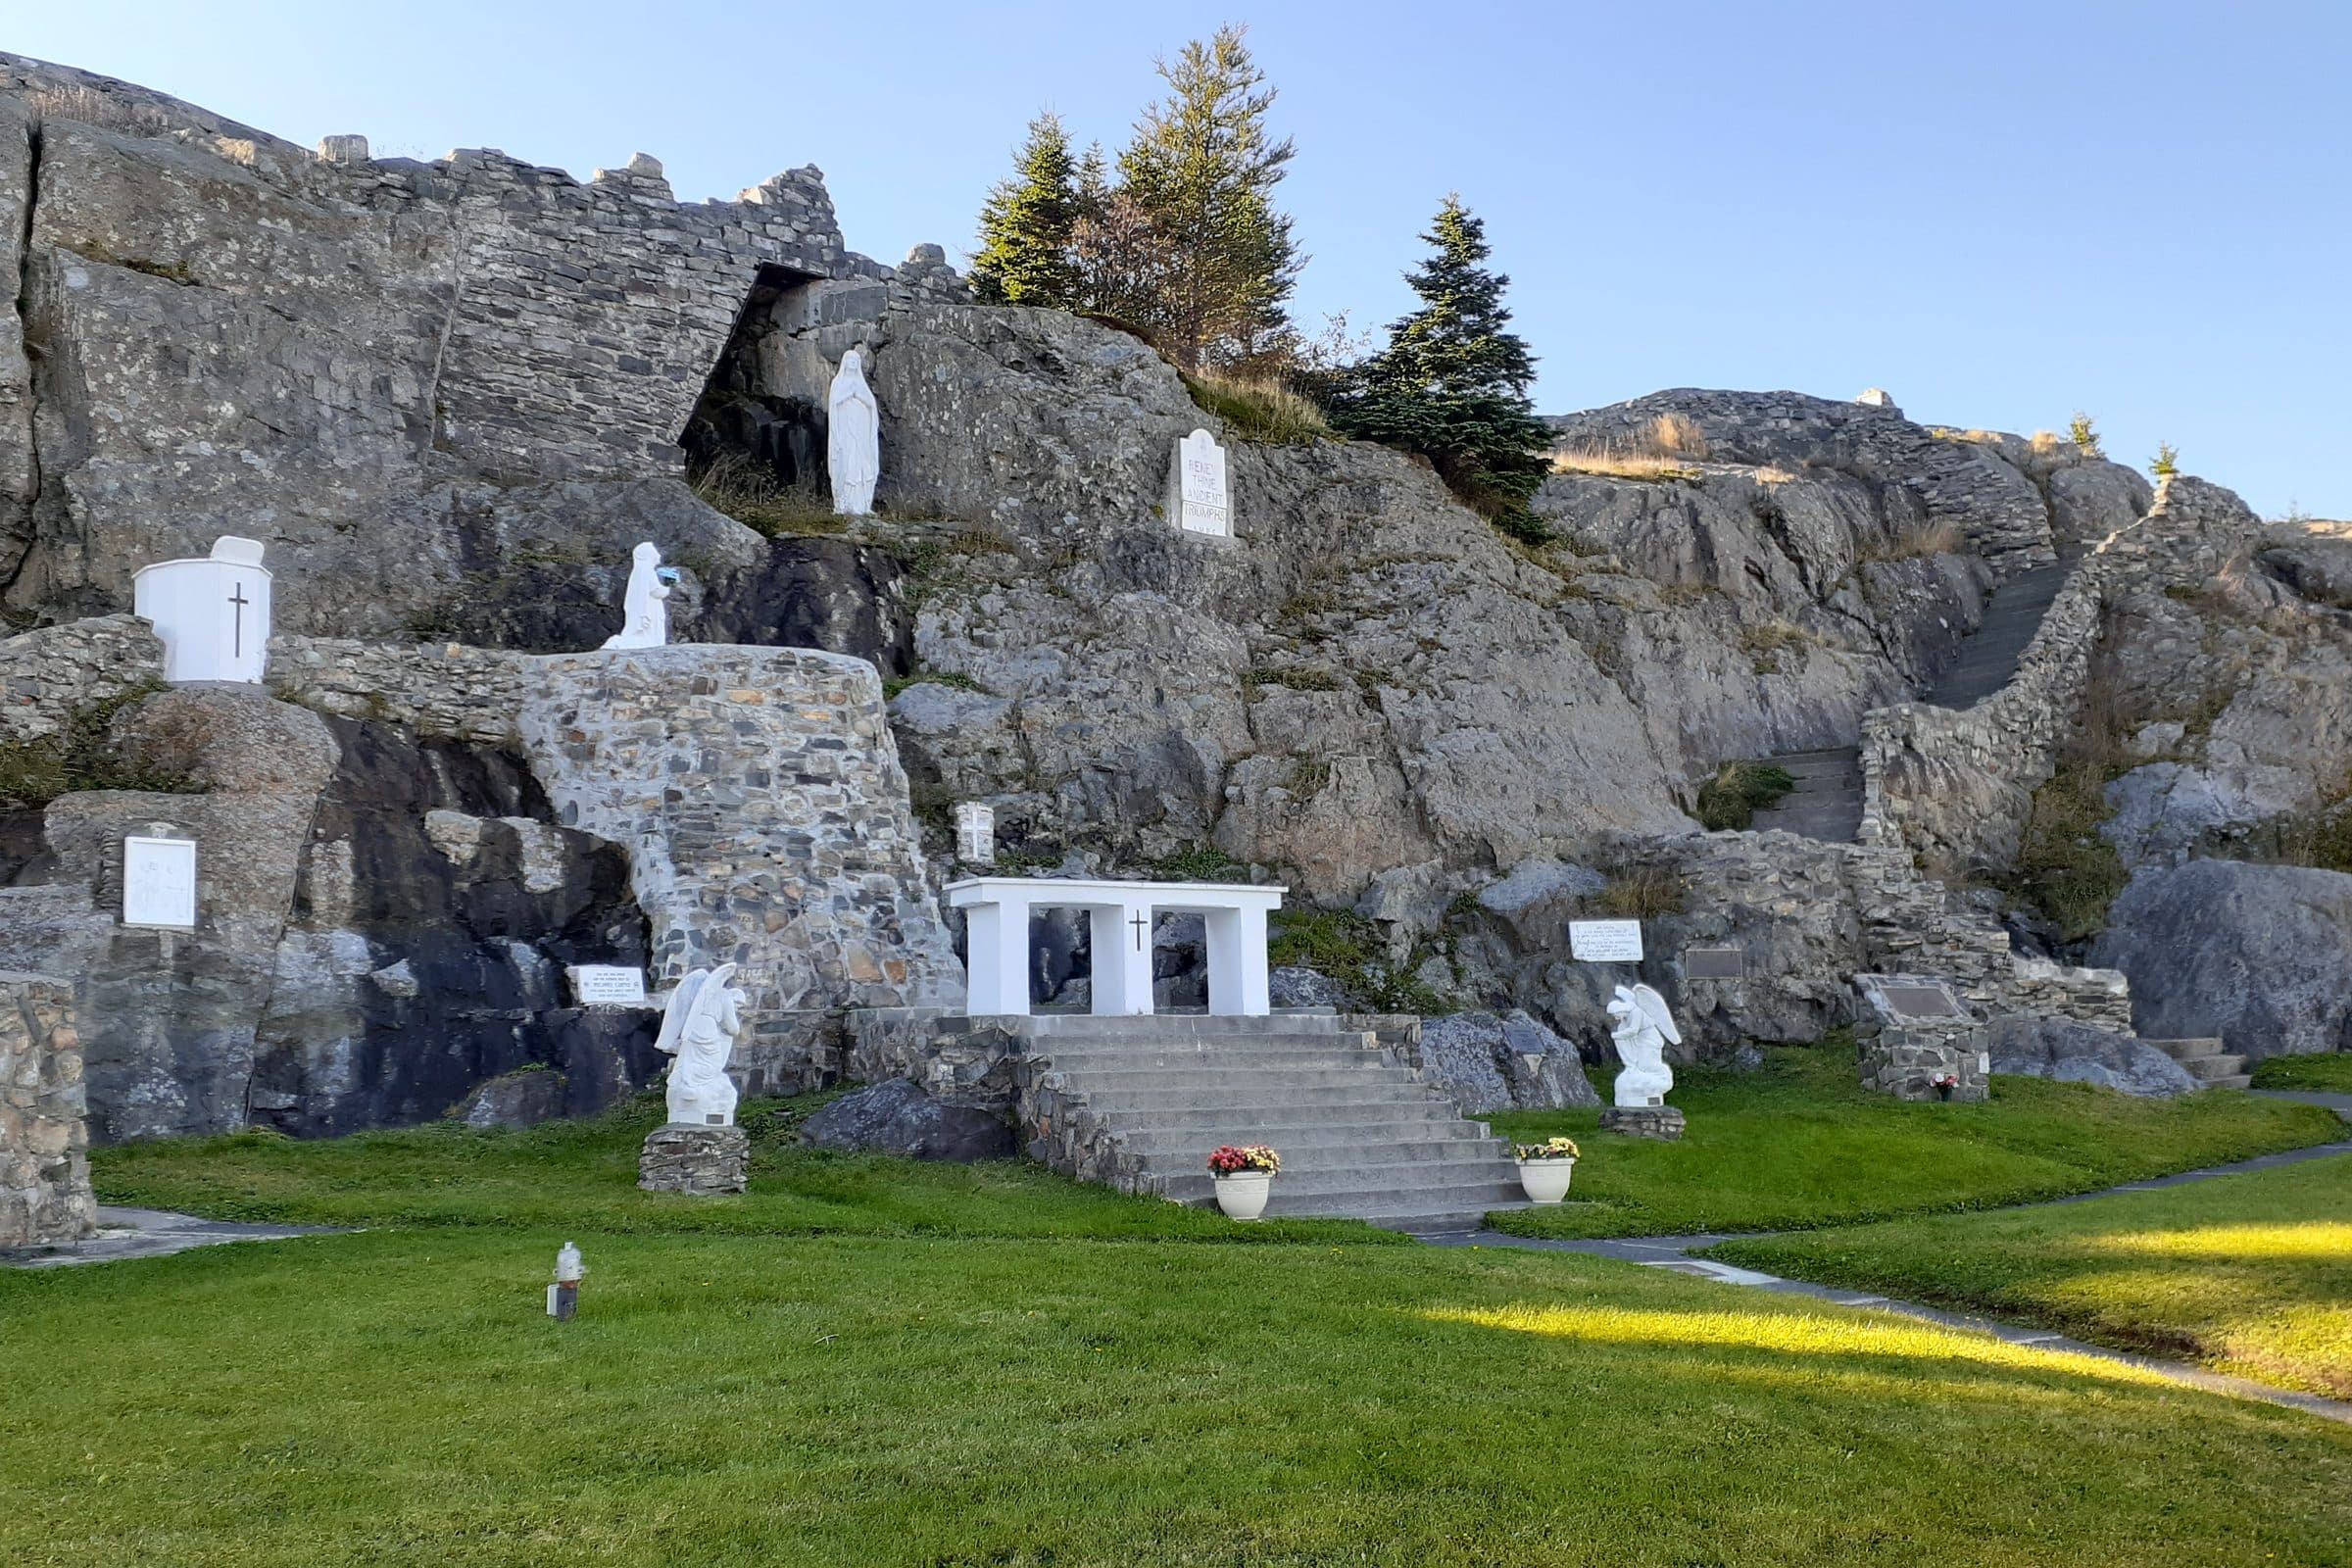
Photo: IMR2000, CC BY-SA 4.0 (cropped)
21 sales in 12 months to Nov 19, 2026
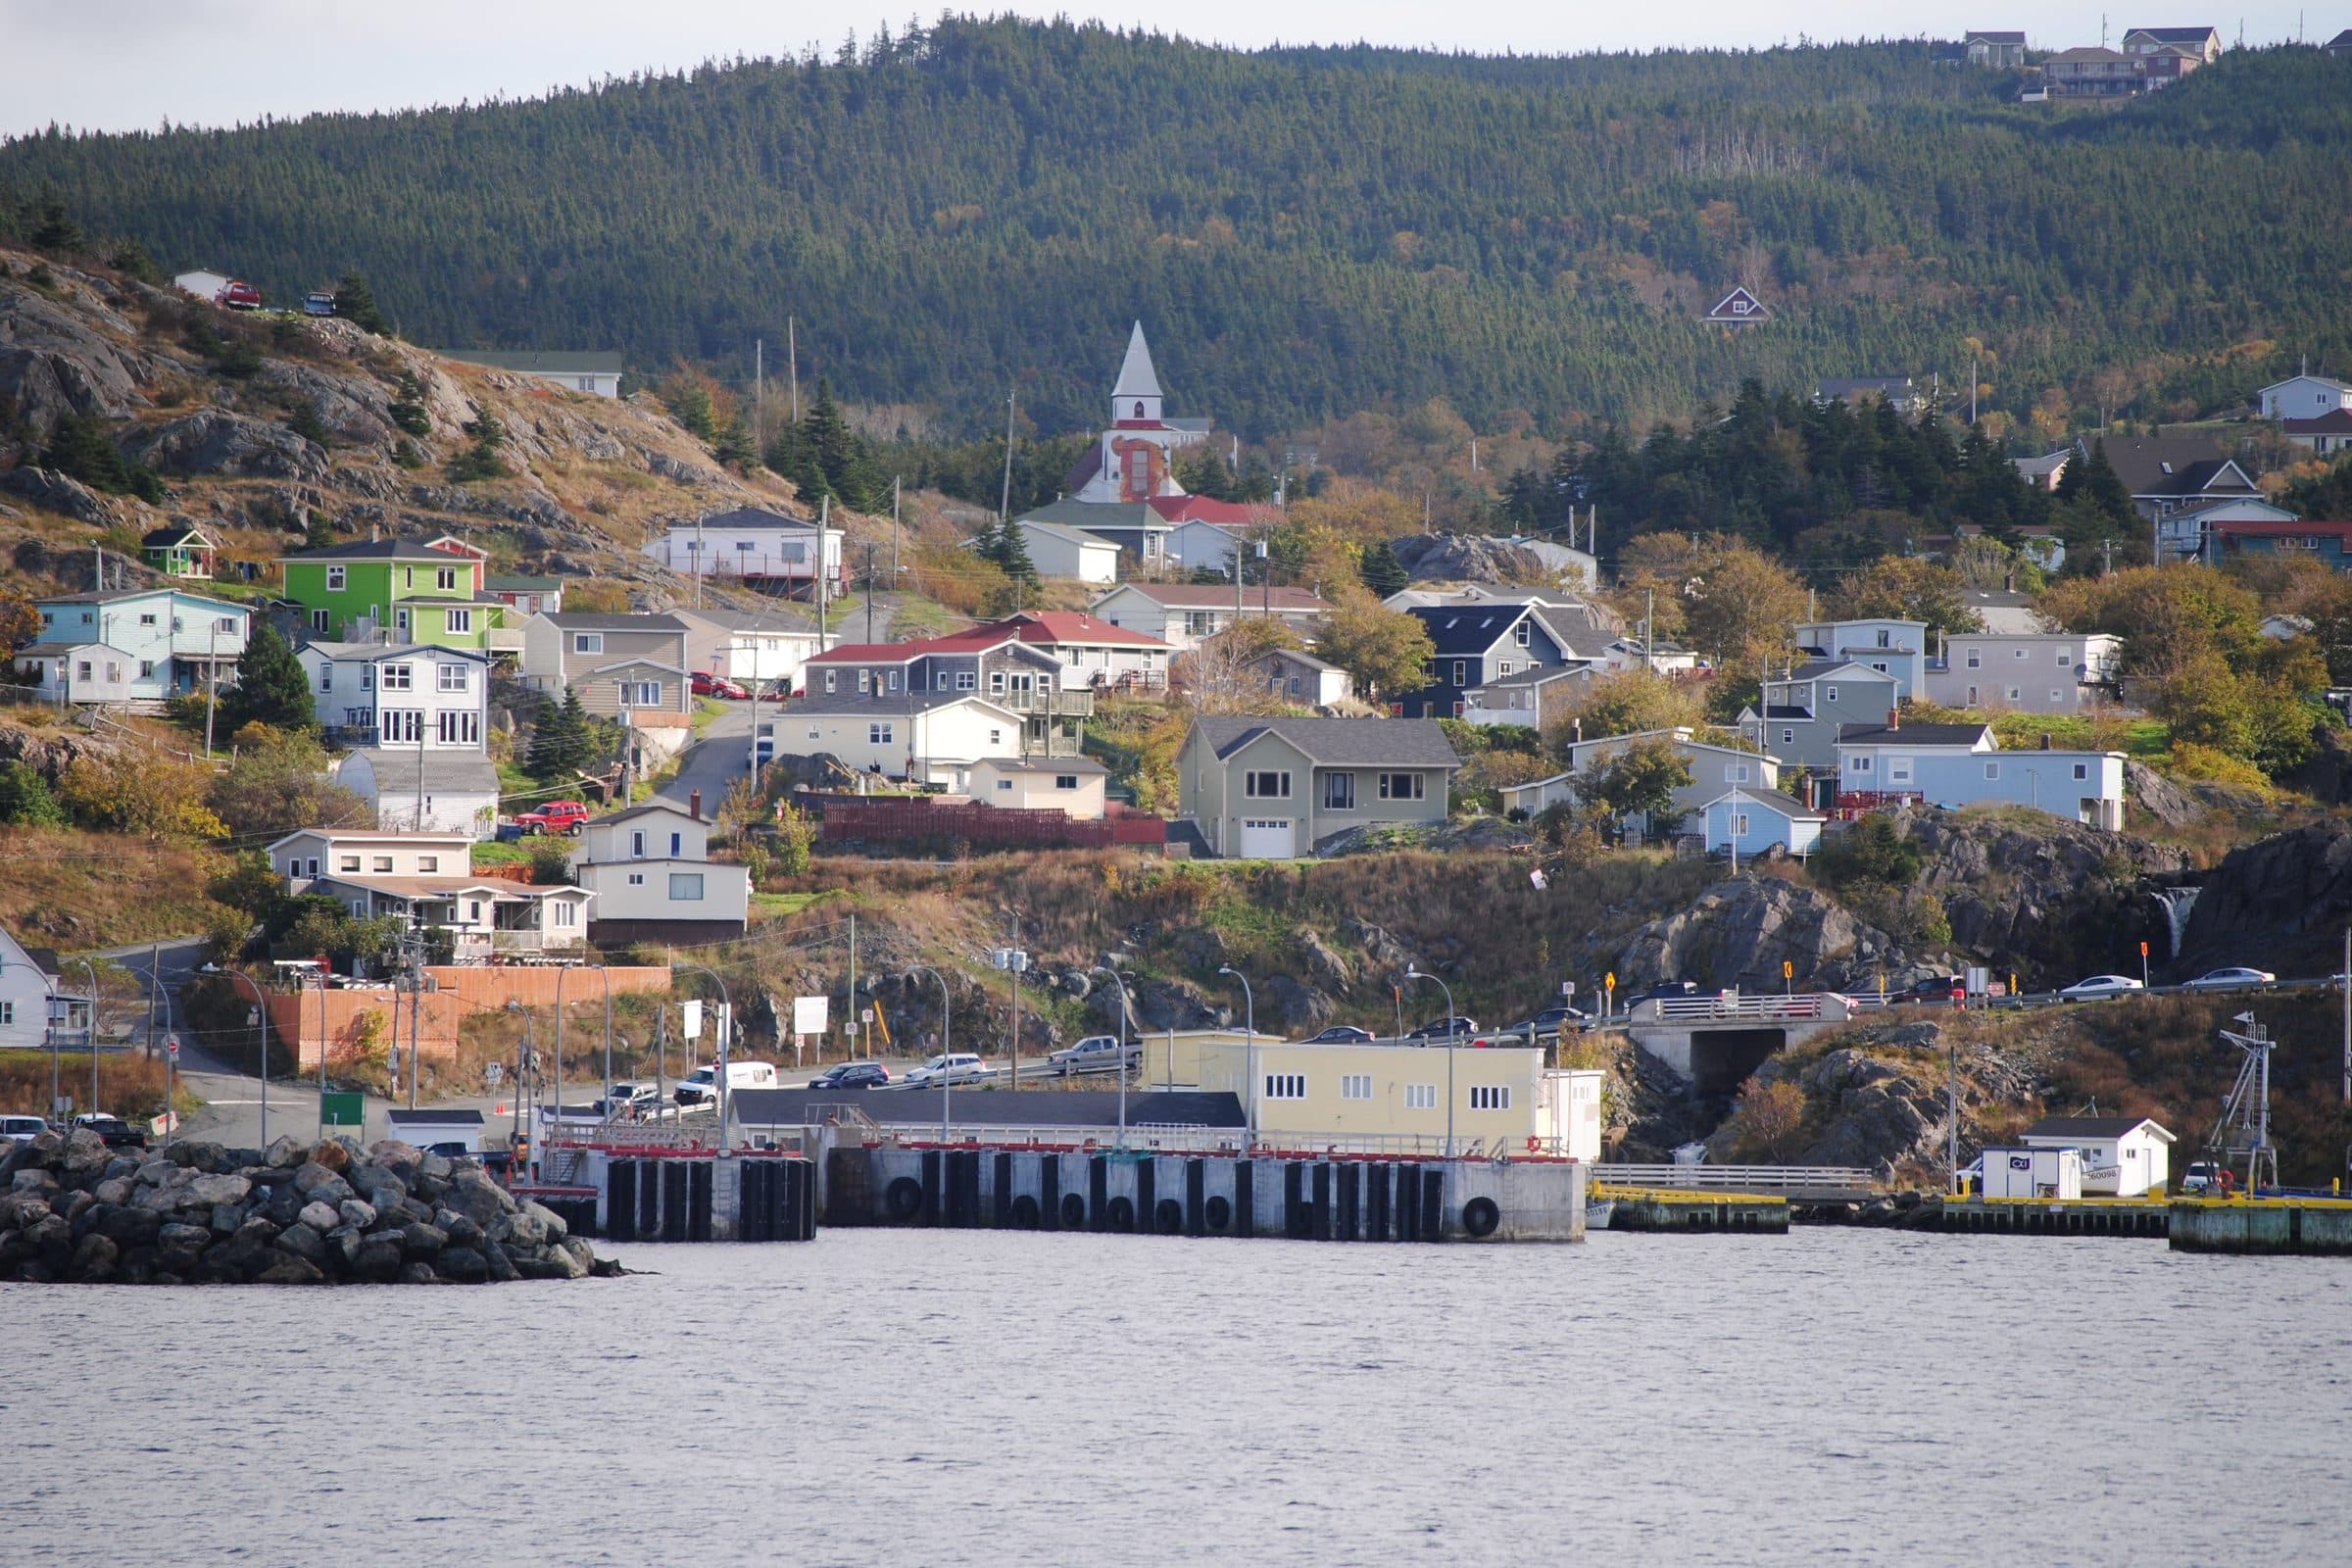
Photo: Paul from Hacketts Cove, Canada, CC BY 2.0 (cropped)
16 sales in 12 months to Nov 19, 2026
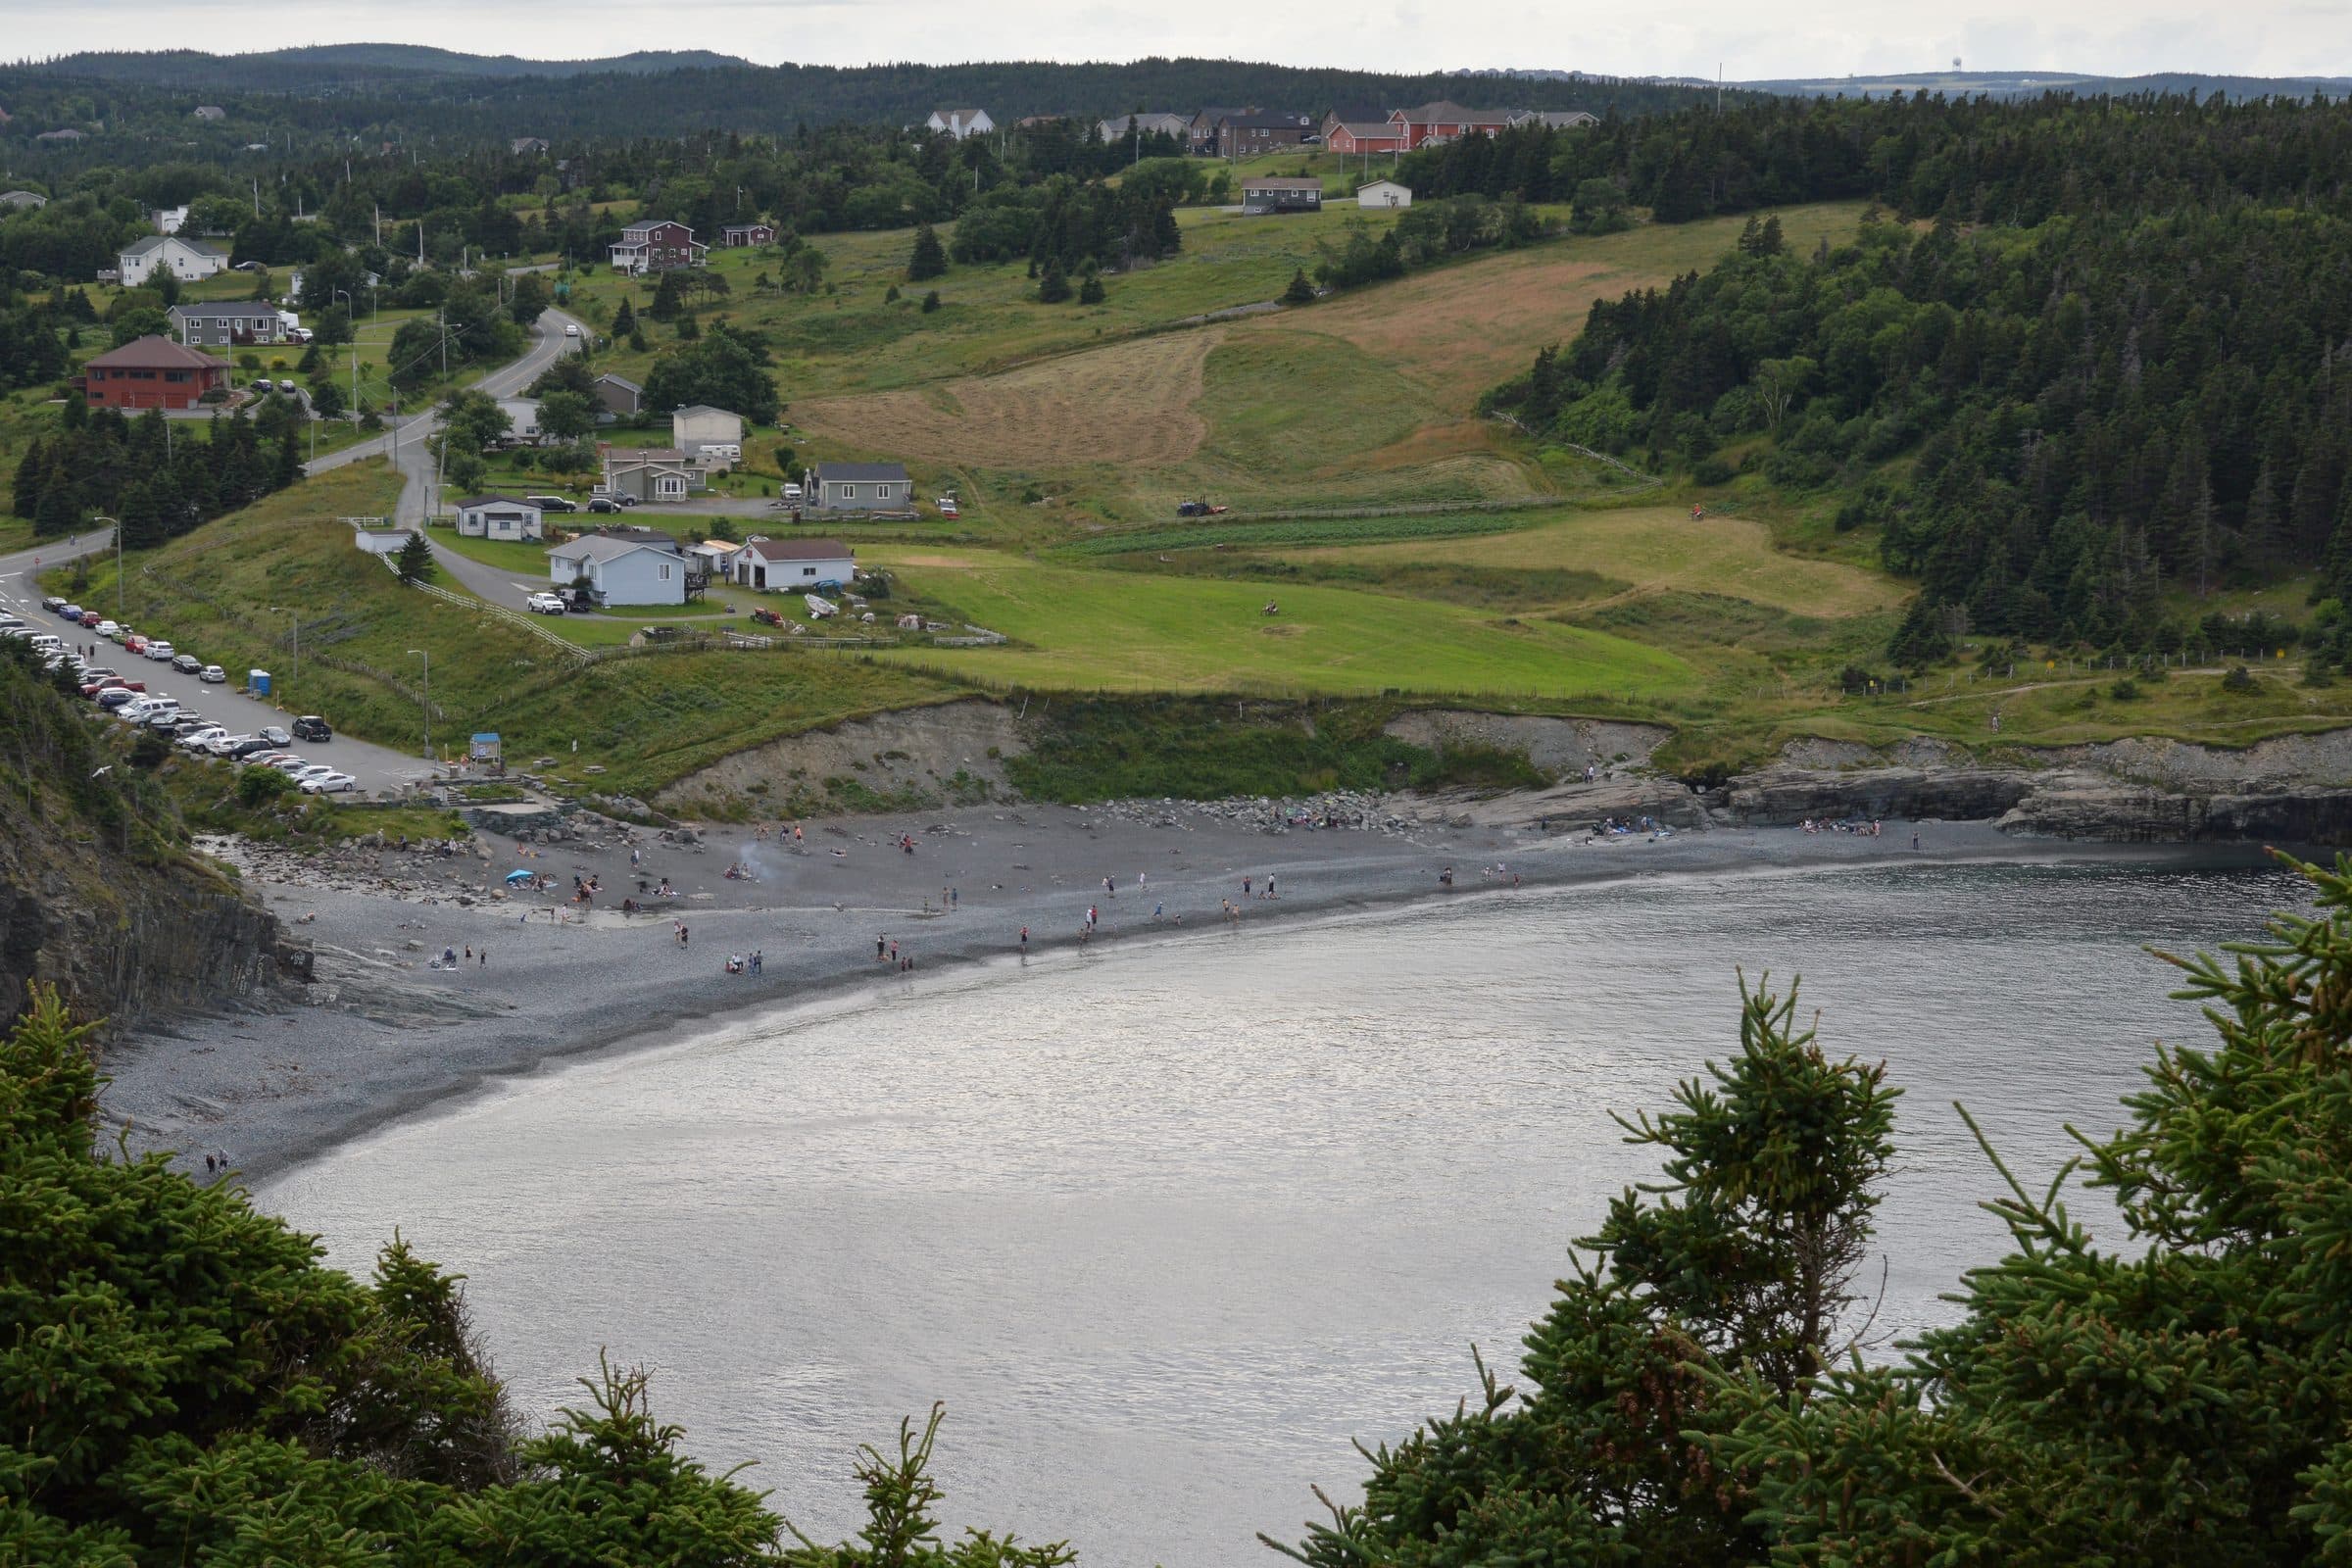
Photo: Ryan Hodnett, CC BY-SA 4.0 (cropped)
10 sales in 12 months to Nov 19, 2026
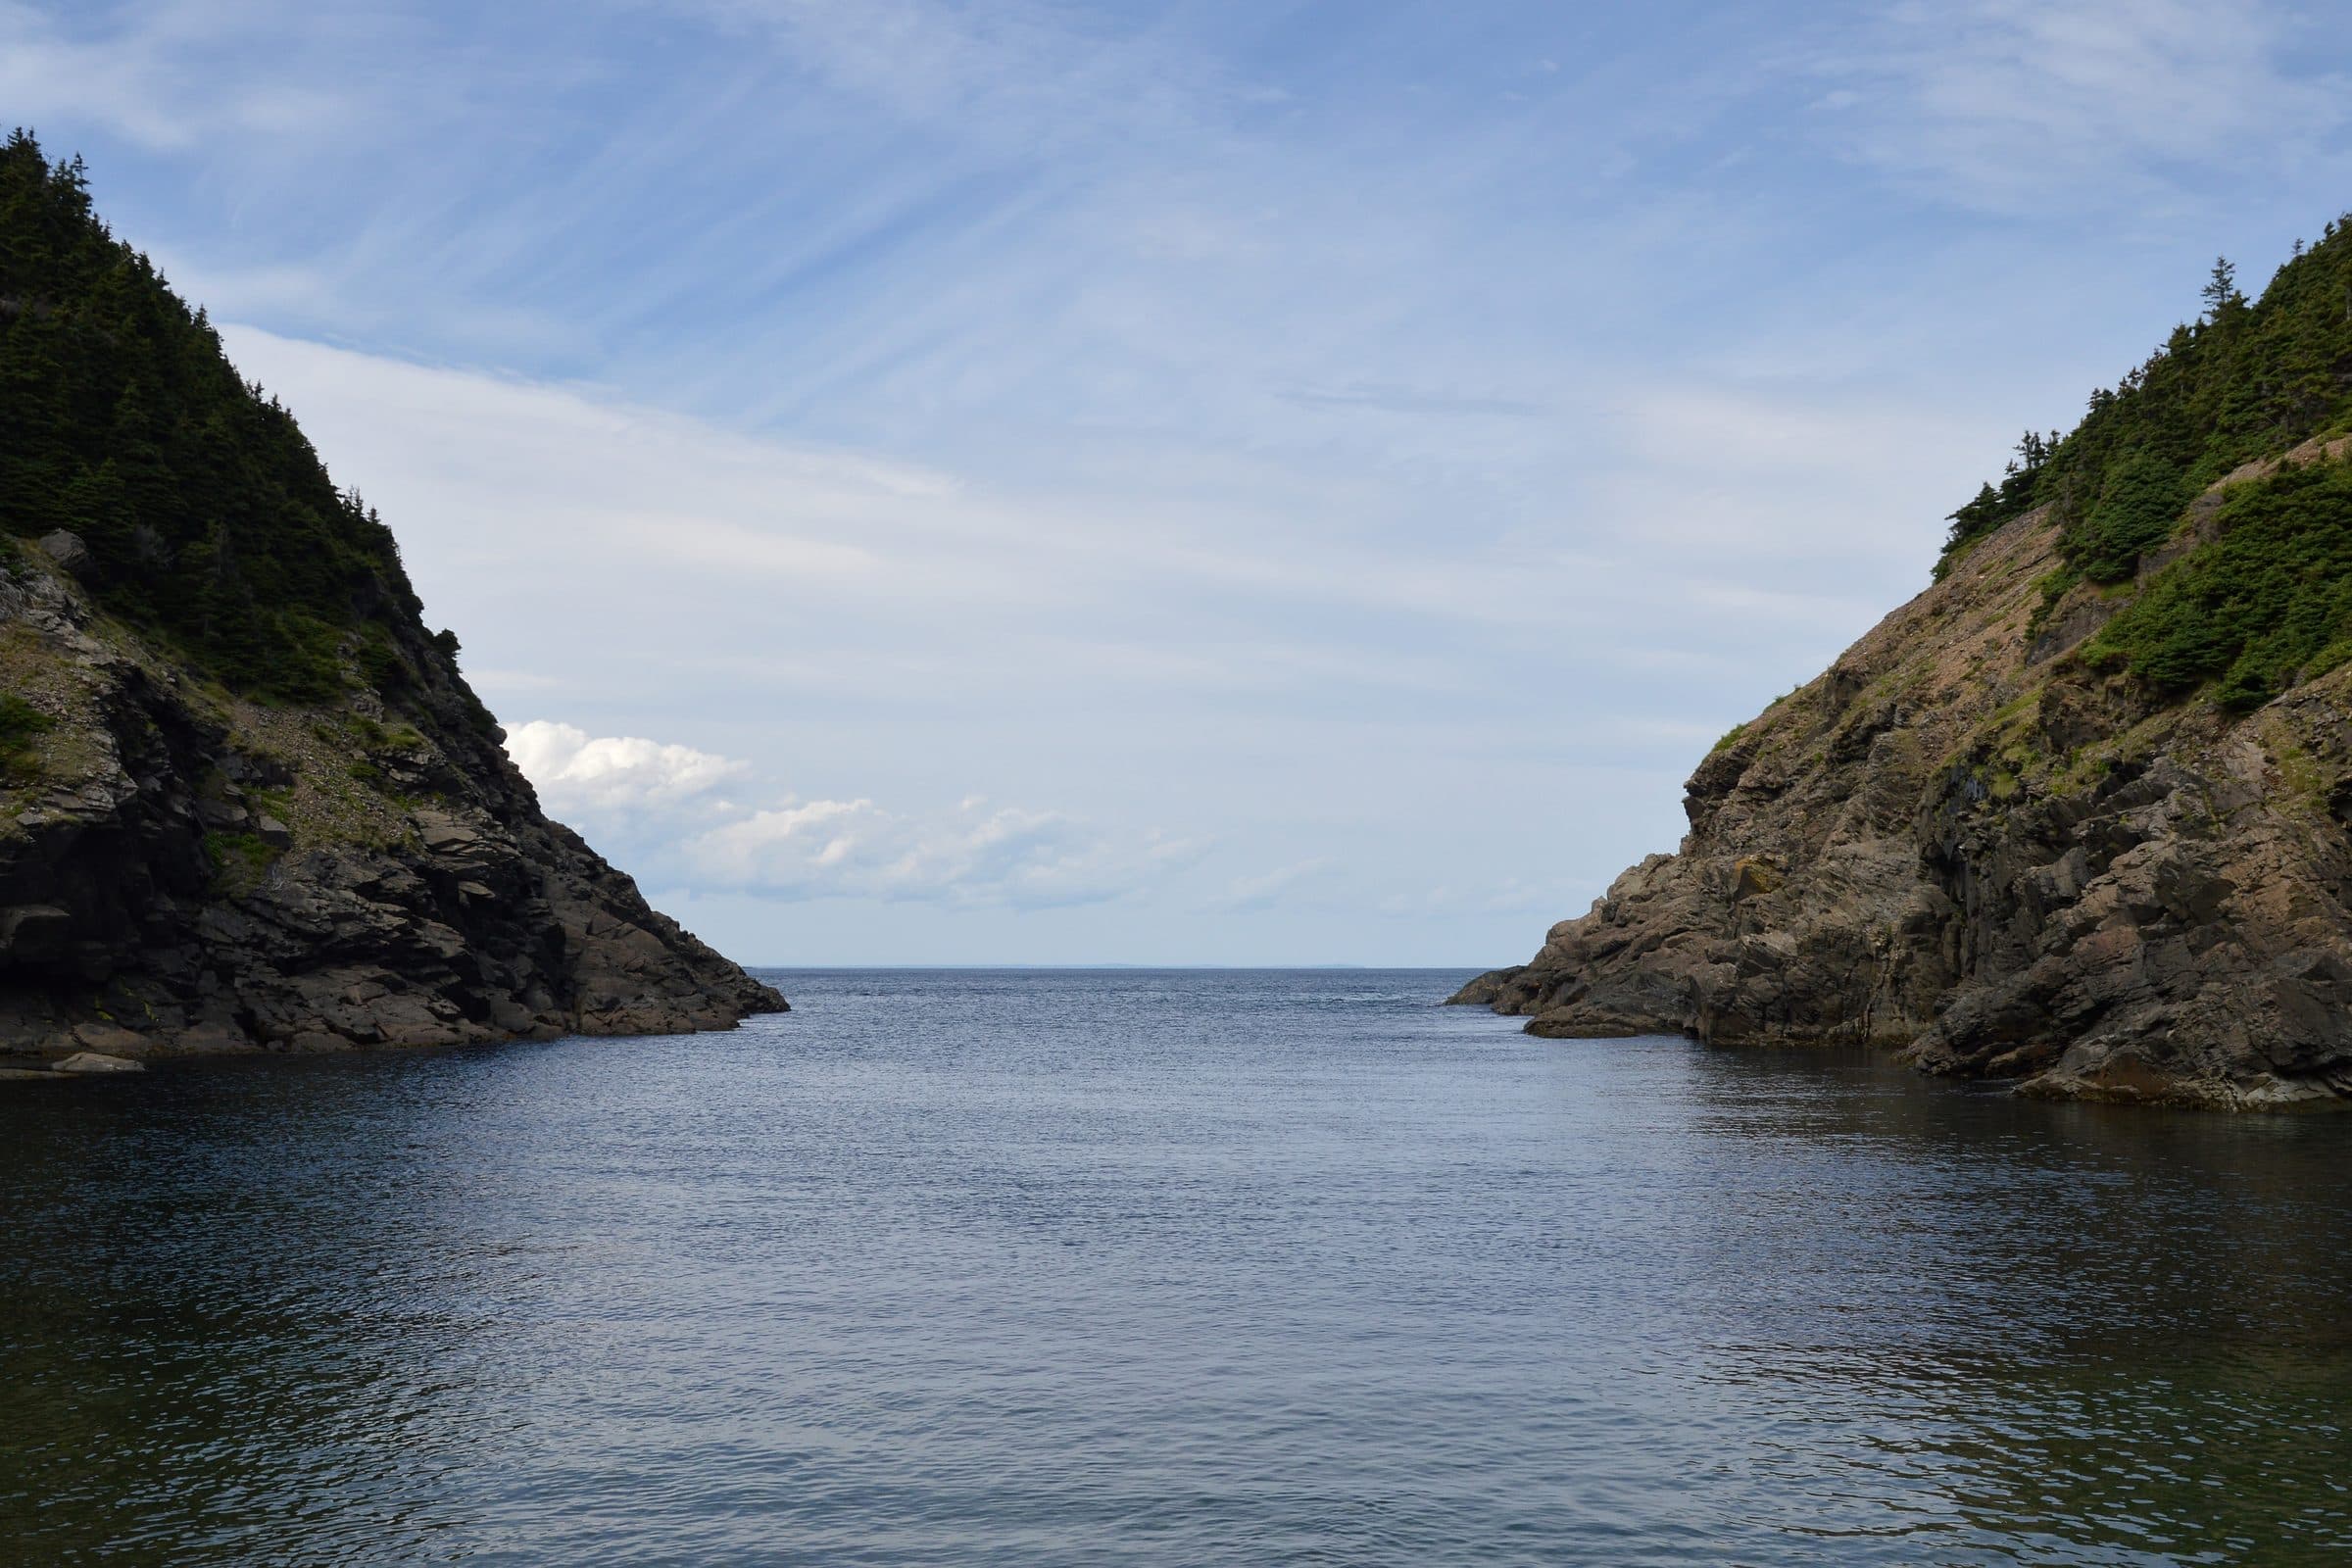
Photo: Ryan Hodnett, CC BY-SA 4.0 (cropped)
54 sales in 12 months to Nov 19, 2026
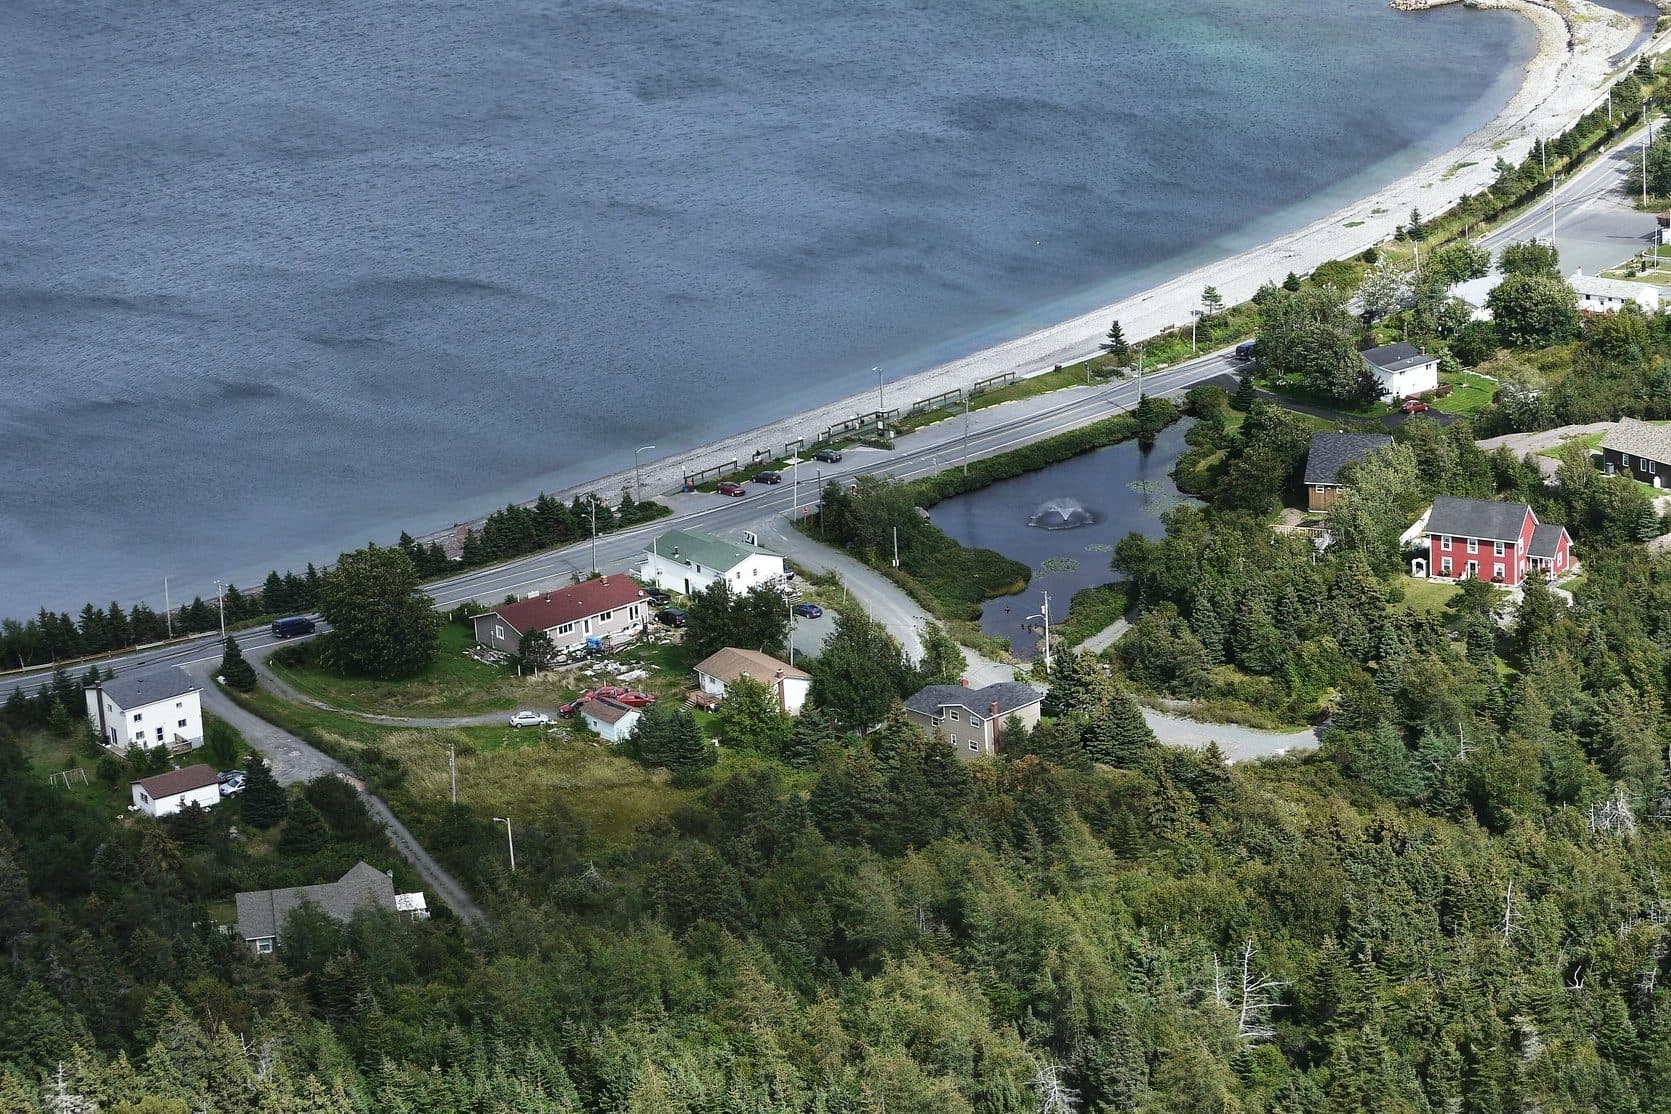
Photo: Emile Baddour, CC0 (cropped)
39 sales in 12 months to Nov 19, 2026
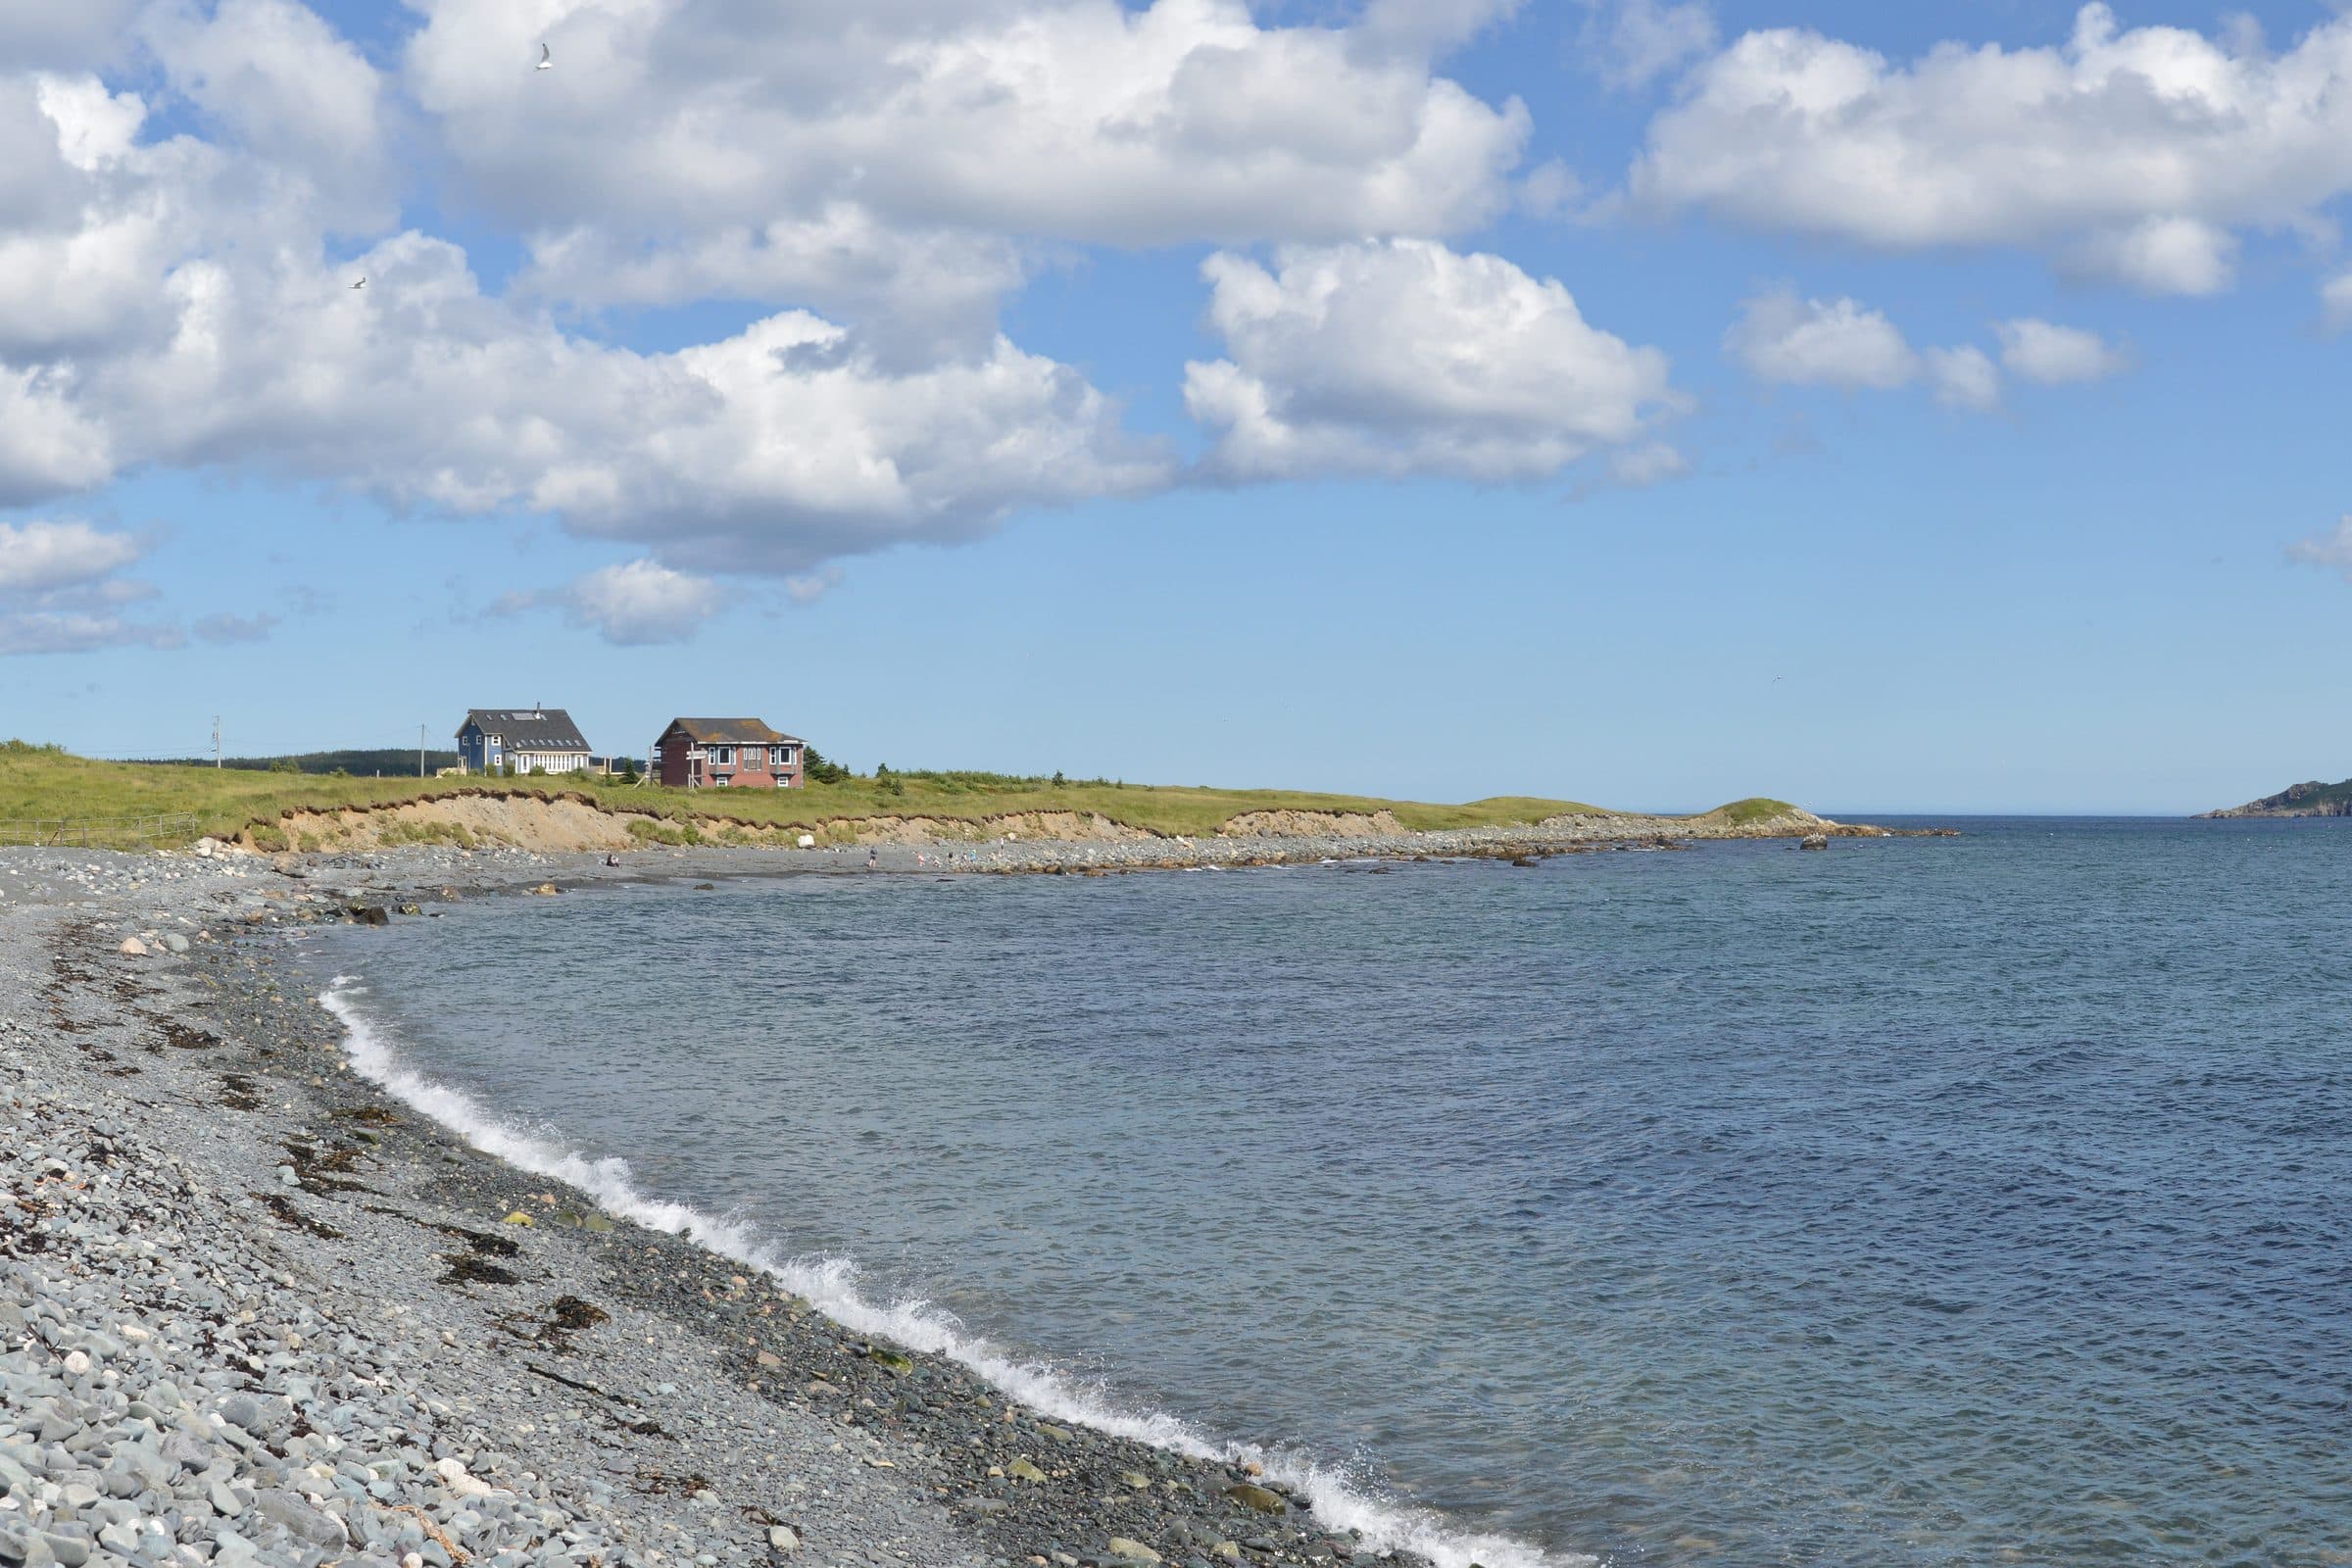
Photo: Ryan Hodnett, CC BY-SA 4.0 (cropped)
14 sales in 12 months to Nov 19, 2026
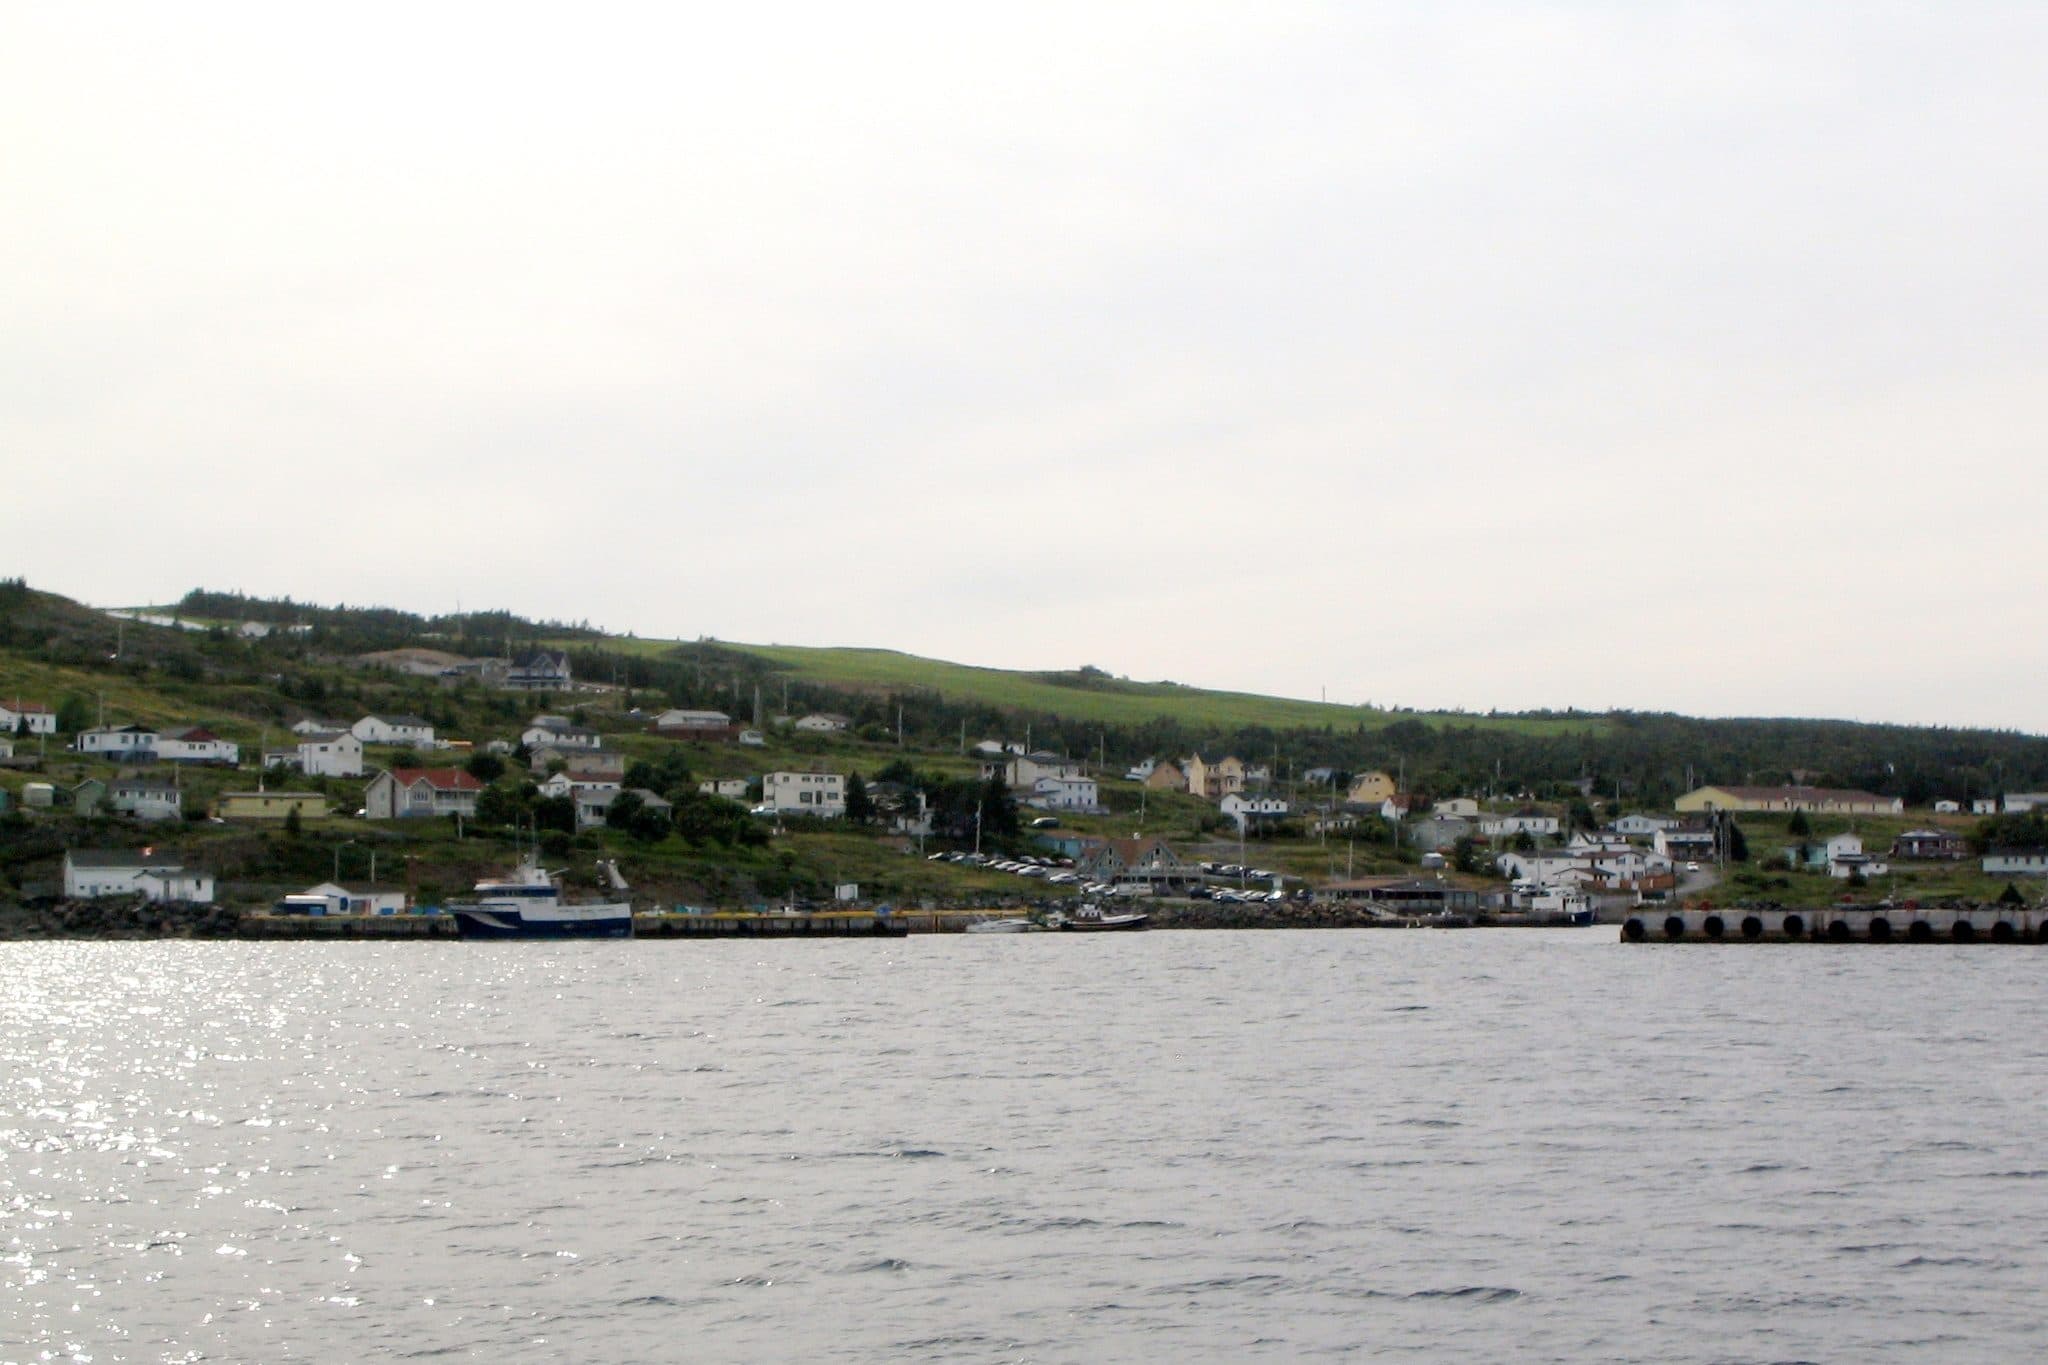
Photo: DonSiano, Public domain (cropped)
19 sales in 12 months to Nov 19, 2026
Side by side
Sort by any column. vs 5 years ago compares the last 12 months' median sold price with the 12 months ending four years ago.
| St. John'sBalanced market | $400,000Avg $425,000 | +29.9% | 32 | Balanced market |
|---|---|---|---|---|
| Mount PearlSeller's market | $400,000Avg $412,000 | +36.1% | 28 | Seller's market |
| ParadiseBuyer's market | $486,000Avg $501,000 | +36.2% | 43 | Buyer's market |
| Conception Bay SouthBalanced market | $427,000Avg $450,000 | +35.6% | 40 | Balanced market |
| TorbayBuyer's market | $471,000Avg $502,000 | +34.6% | 38 | Buyer's market |
| FlatrockBuyer's market | $460,000Avg $439,000 | +31.4% | 35 | Buyer's market |
| Portugal Cove-St. Philip'sBalanced marketLimited data | $494,950Avg $517,000 | +40.4% | 31 | Balanced market |
| Logy Bay-Middle Cove-Outer CoveBuyer's marketLimited data | $977,500Avg $949,000 | +84.7% | 43 | Buyer's market |
| Pouch CoveBalanced market | $359,950Avg $360,000 | +38.2% | 62 | Balanced market |
| HolyroodBuyer's market | $340,000Avg $436,000 | -4.4% | 50 | Buyer's market |
| Witless BayBalanced marketLimited data | $447,450Avg $412,000 | +25.2% | 51 | Balanced market |
| Bay BullsBuyer's marketLimited data | $490,000Avg $452,000 | +32.4% | 75 | Buyer's market |
Communities with fewer than 20 sales in the last 12 months carry a "Limited data" badge. A handful of sales can move a median a long way, so read those rows as a guide, not a rule.
These figures describe whole communities. For a range on your own home, built from street-level comparable sales and reviewed by a REALTOR®, start with a home value estimate.
Market figures are Apex Atlas analysis of residential MLS® solds licensed from the Newfoundland and Labrador Association of REALTORS®. Medians and averages are Apex's own derived analytics. Estimates are not appraisals. MLS®, REALTOR® and the associated logos are trademarks of The Canadian Real Estate Association. DDF® is owned by CREA. Each RE/MAX office is independently owned and operated.